Glioblastoma multiforme (GBM) remains one of oncology's most formidable challenges. With median survival hovering at 15 months and a 5-year survival rate below 7%, patients and clinicians are desperate for new treatment options.
Yet despite 1,913 clinical trials registered on ClinicalTrials.gov, the treatment landscape looks remarkably similar to a decade ago. Our analysis of the complete GBM trial database reveals three critical insights that explain this paradox, and point toward where the field must go next.
1. The Immunotherapy Disconnect
The promise was immense. Checkpoint inhibitors revolutionized melanoma, lung cancer, and a dozen other malignancies. Naturally, researchers turned their attention to GBM.
The results have been sobering:
- 682 immunotherapy trials conducted for GBM to date
- Zero checkpoint inhibitors approved for GBM
- 100+ PD-1/PD-L1 trials have failed to demonstrate survival benefits
Why the disconnect? GBM tumors are immunologically "cold," characterized by low tumor mutational burden, an immunosuppressive microenvironment, and the blood-brain barrier limiting immune cell infiltration.
The data visualization in Figure 1 captures this stark reality: massive trial investment with no regulatory success.
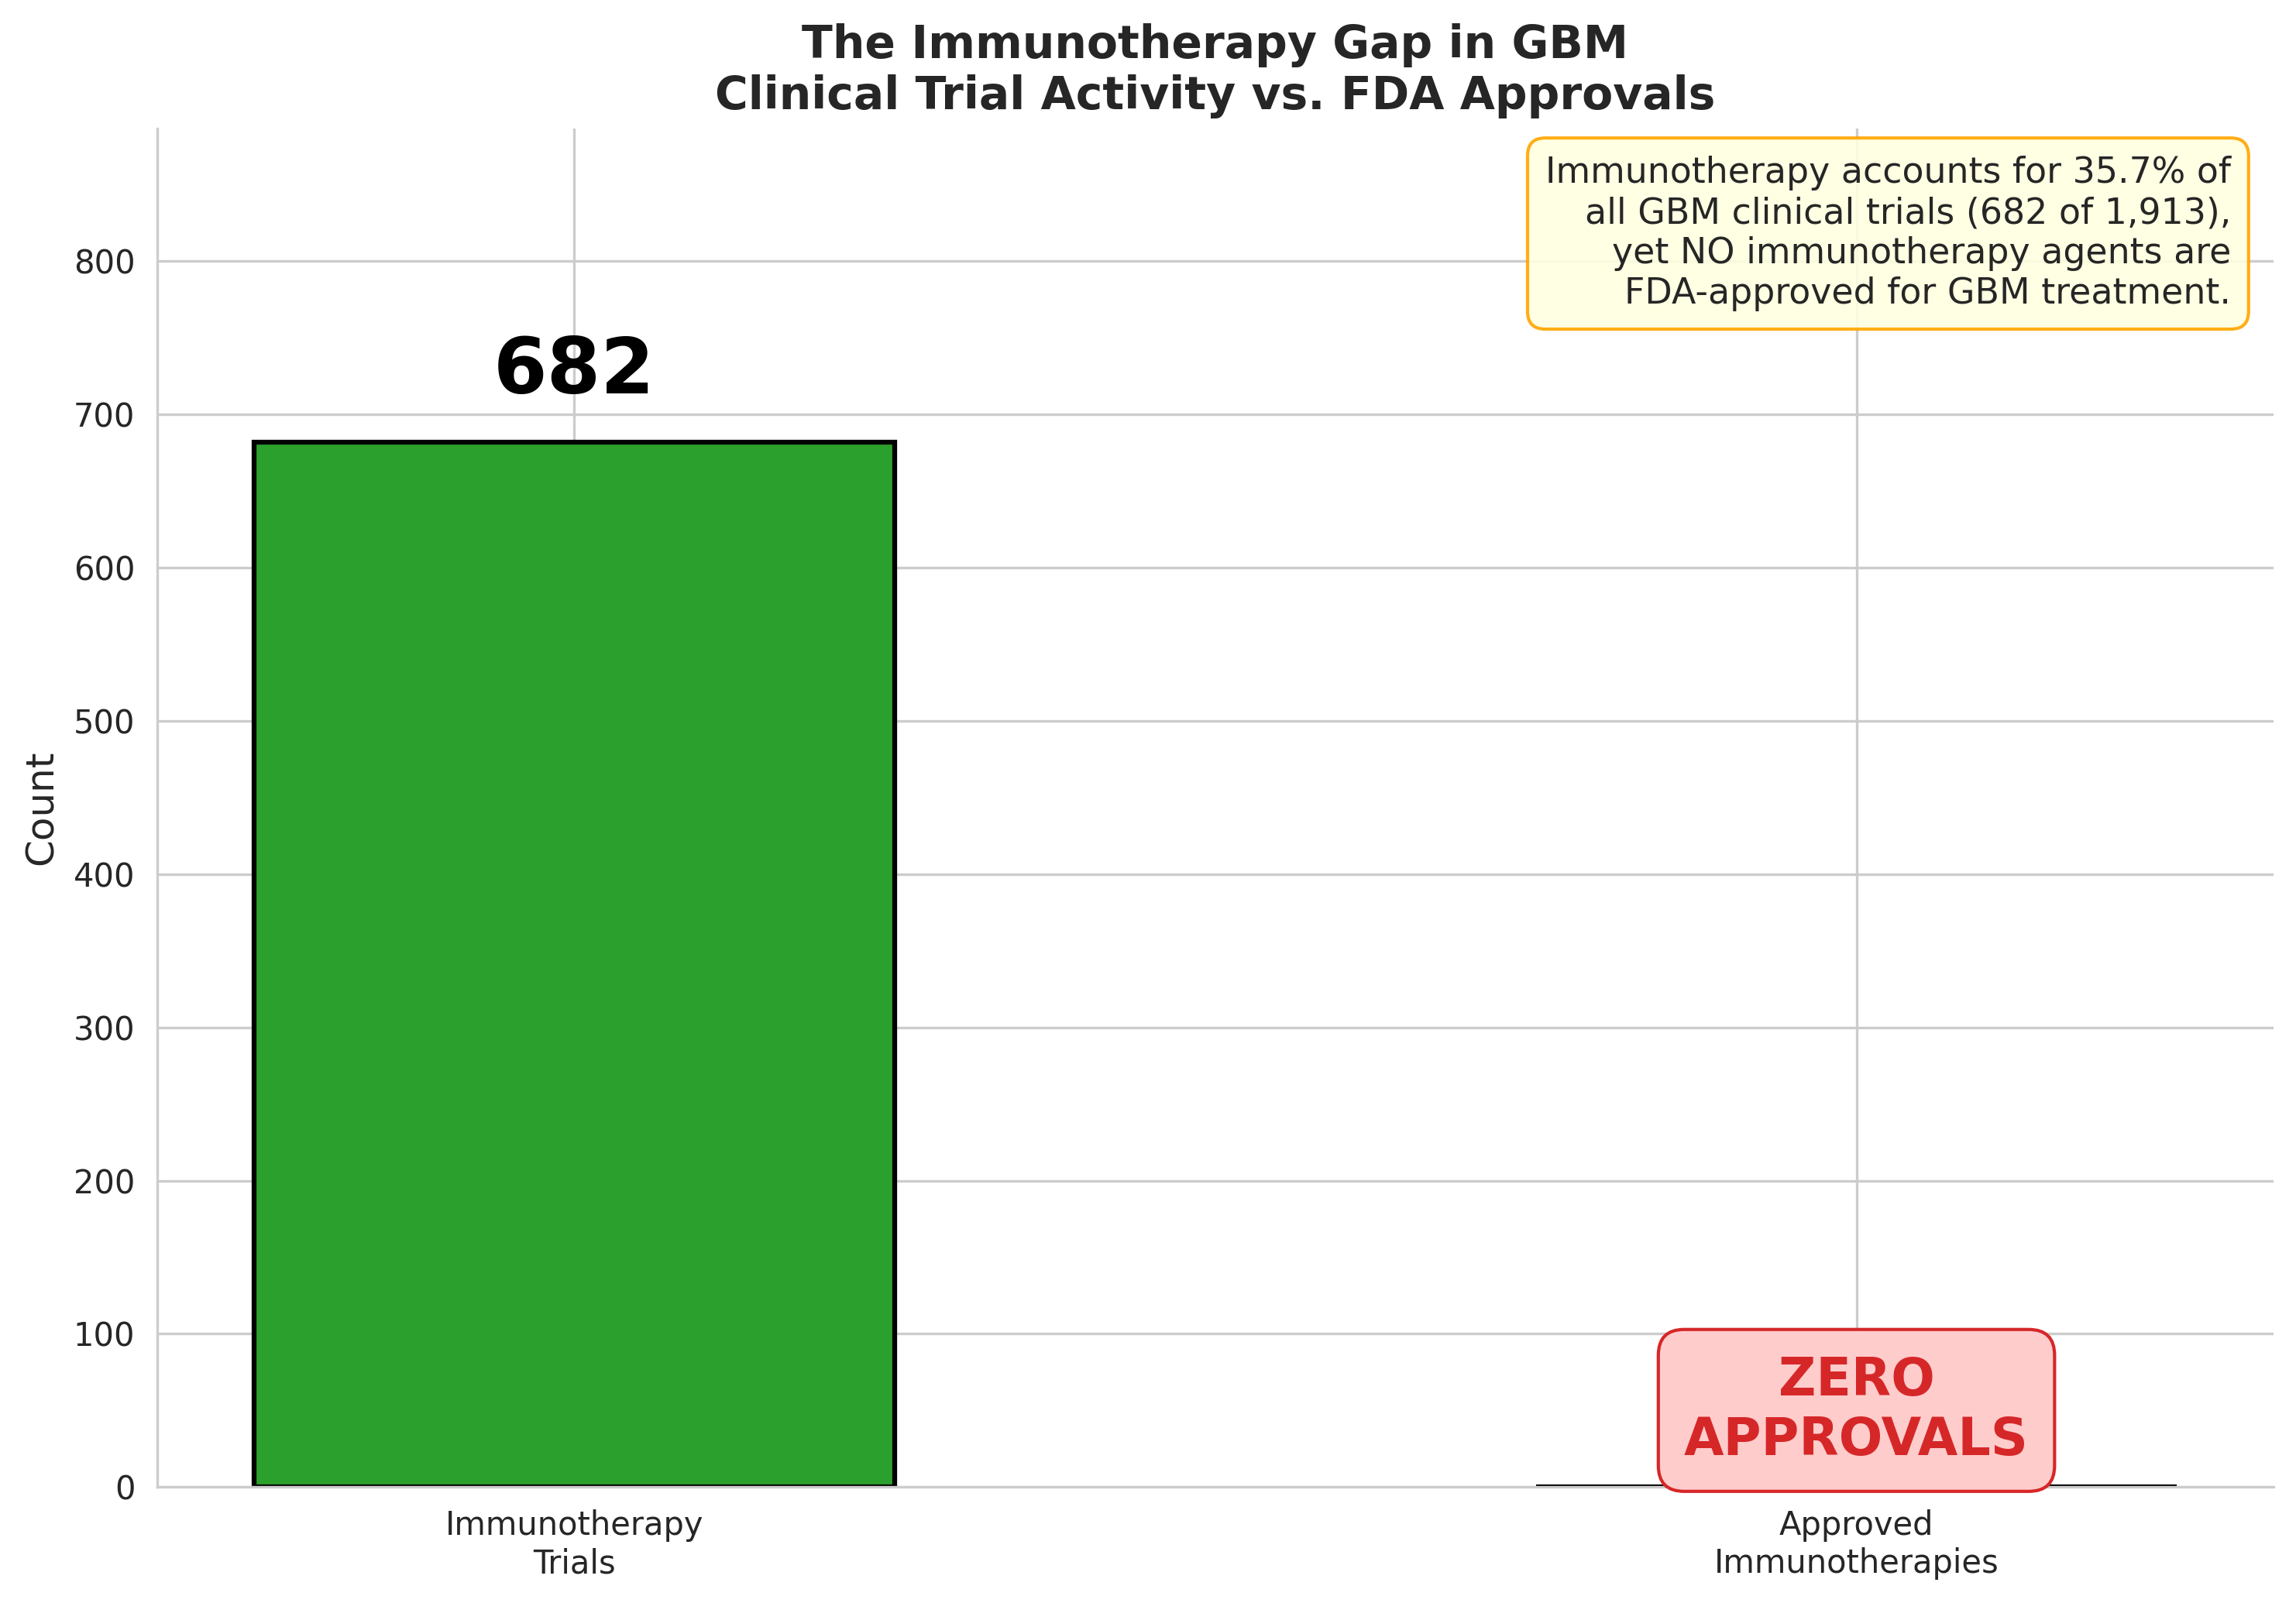
Figure 1: Immunotherapy trial volume vs. approvals: 682 trials, zero breakthrough drugs.
2. Pipeline Attrition Reality
Clinical development in GBM follows a brutal attrition curve (Figure 2). Our analysis of trial progression reveals:
- Phase 1 to Phase 2: 860 → 927 trials (aggregated)
- Phase 2 to Phase 3: 927 → 115 trials (87.6% drop)
- Phase 3 to Approval: <5% success rate
The Phase 2 cliff is particularly devastating. This is where efficacy failures concentrate. Promising early signals evaporate when faced with larger, randomized populations.
Novel targets face even steeper odds. Only 25.9% of trials investigate already-approved mechanisms, while 20.8% pursue entirely novel approaches with uncertain regulatory pathways.
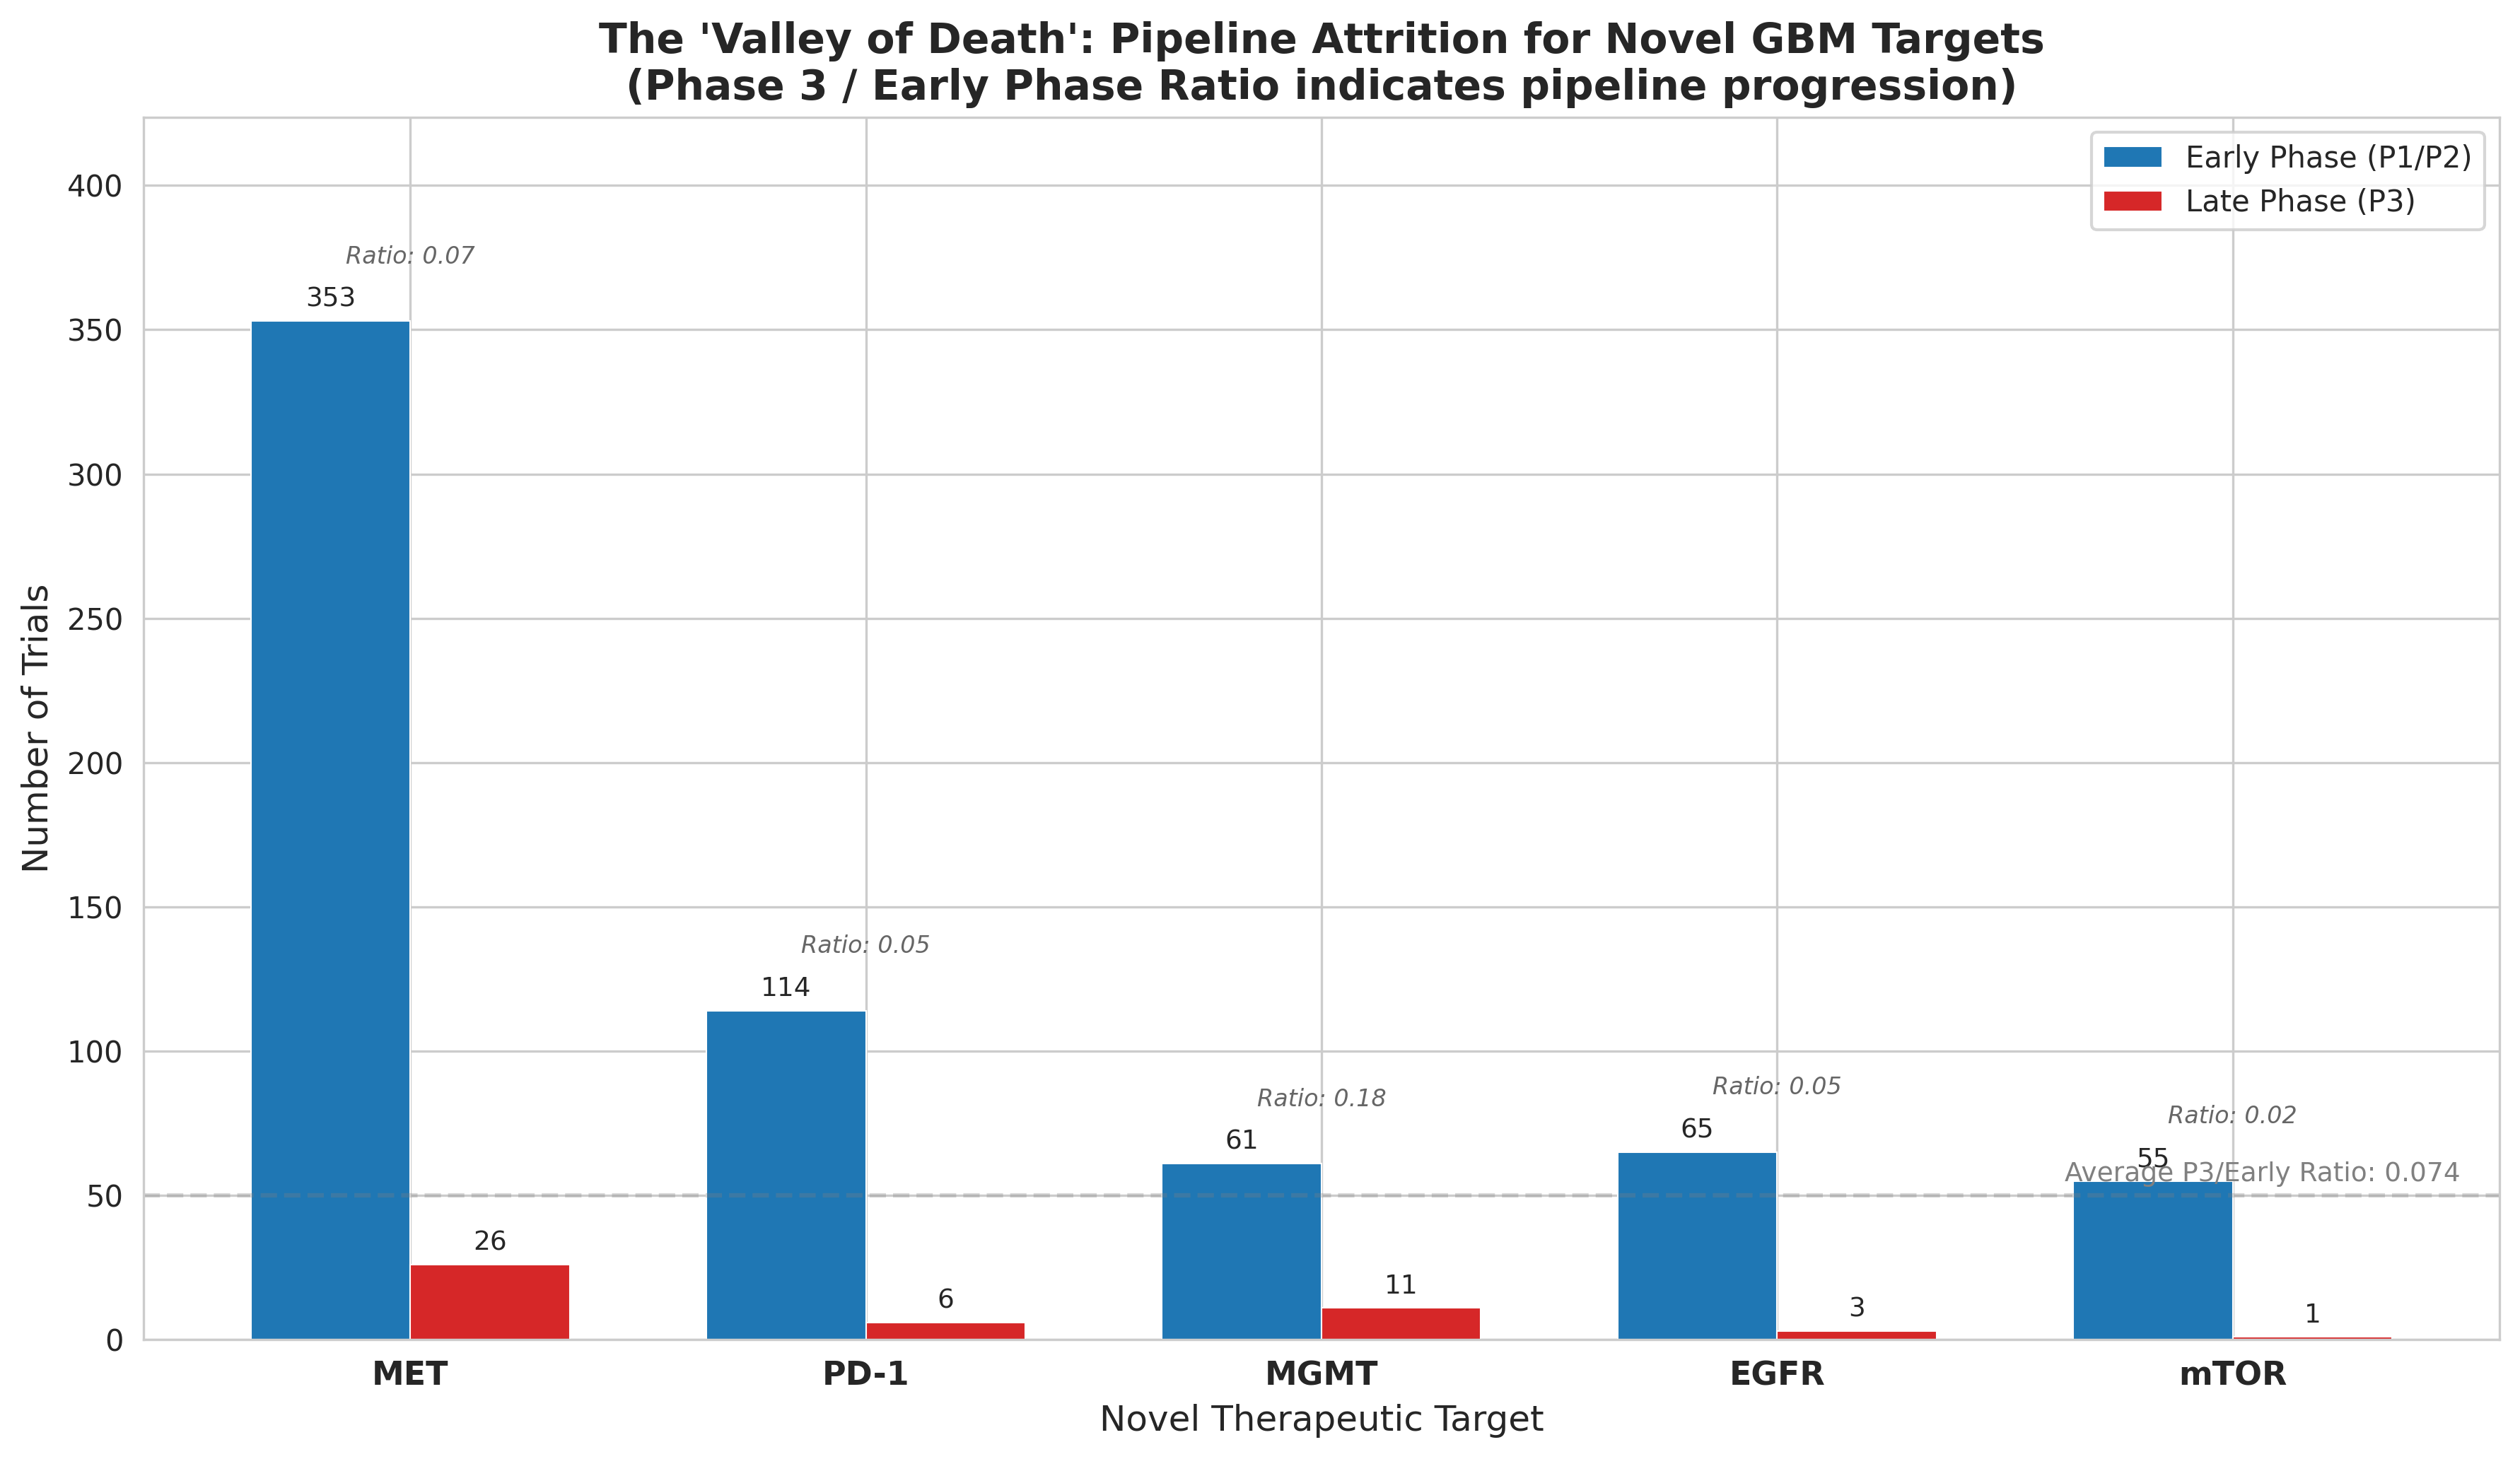
Figure 2: Pipeline attrition across development phases. Phase 2 represents the steepest cliff.
3. The Funding Landscape Shift
Who's funding these trials matters enormously for what gets developed and how.
Our sponsor analysis in Figure 3 reveals a clear division of labor:
- Academic/Other sponsors: 68.0% of all trials (1,301 trials)
- Industry sponsors: 24.5% overall, but 40.0% of Phase 3 trials
- NIH/Federal: 7.5% of trials (declining trend)
The pattern is clear: academia explores, industry commercializes. But this creates a "valley of death" where promising academic discoveries struggle to attract industry investment for expensive late-stage trials.
Biotech companies are increasingly filling this gap, driving early-stage innovation in areas like viral/gene therapy (97 trials) where big pharma has been hesitant to invest.
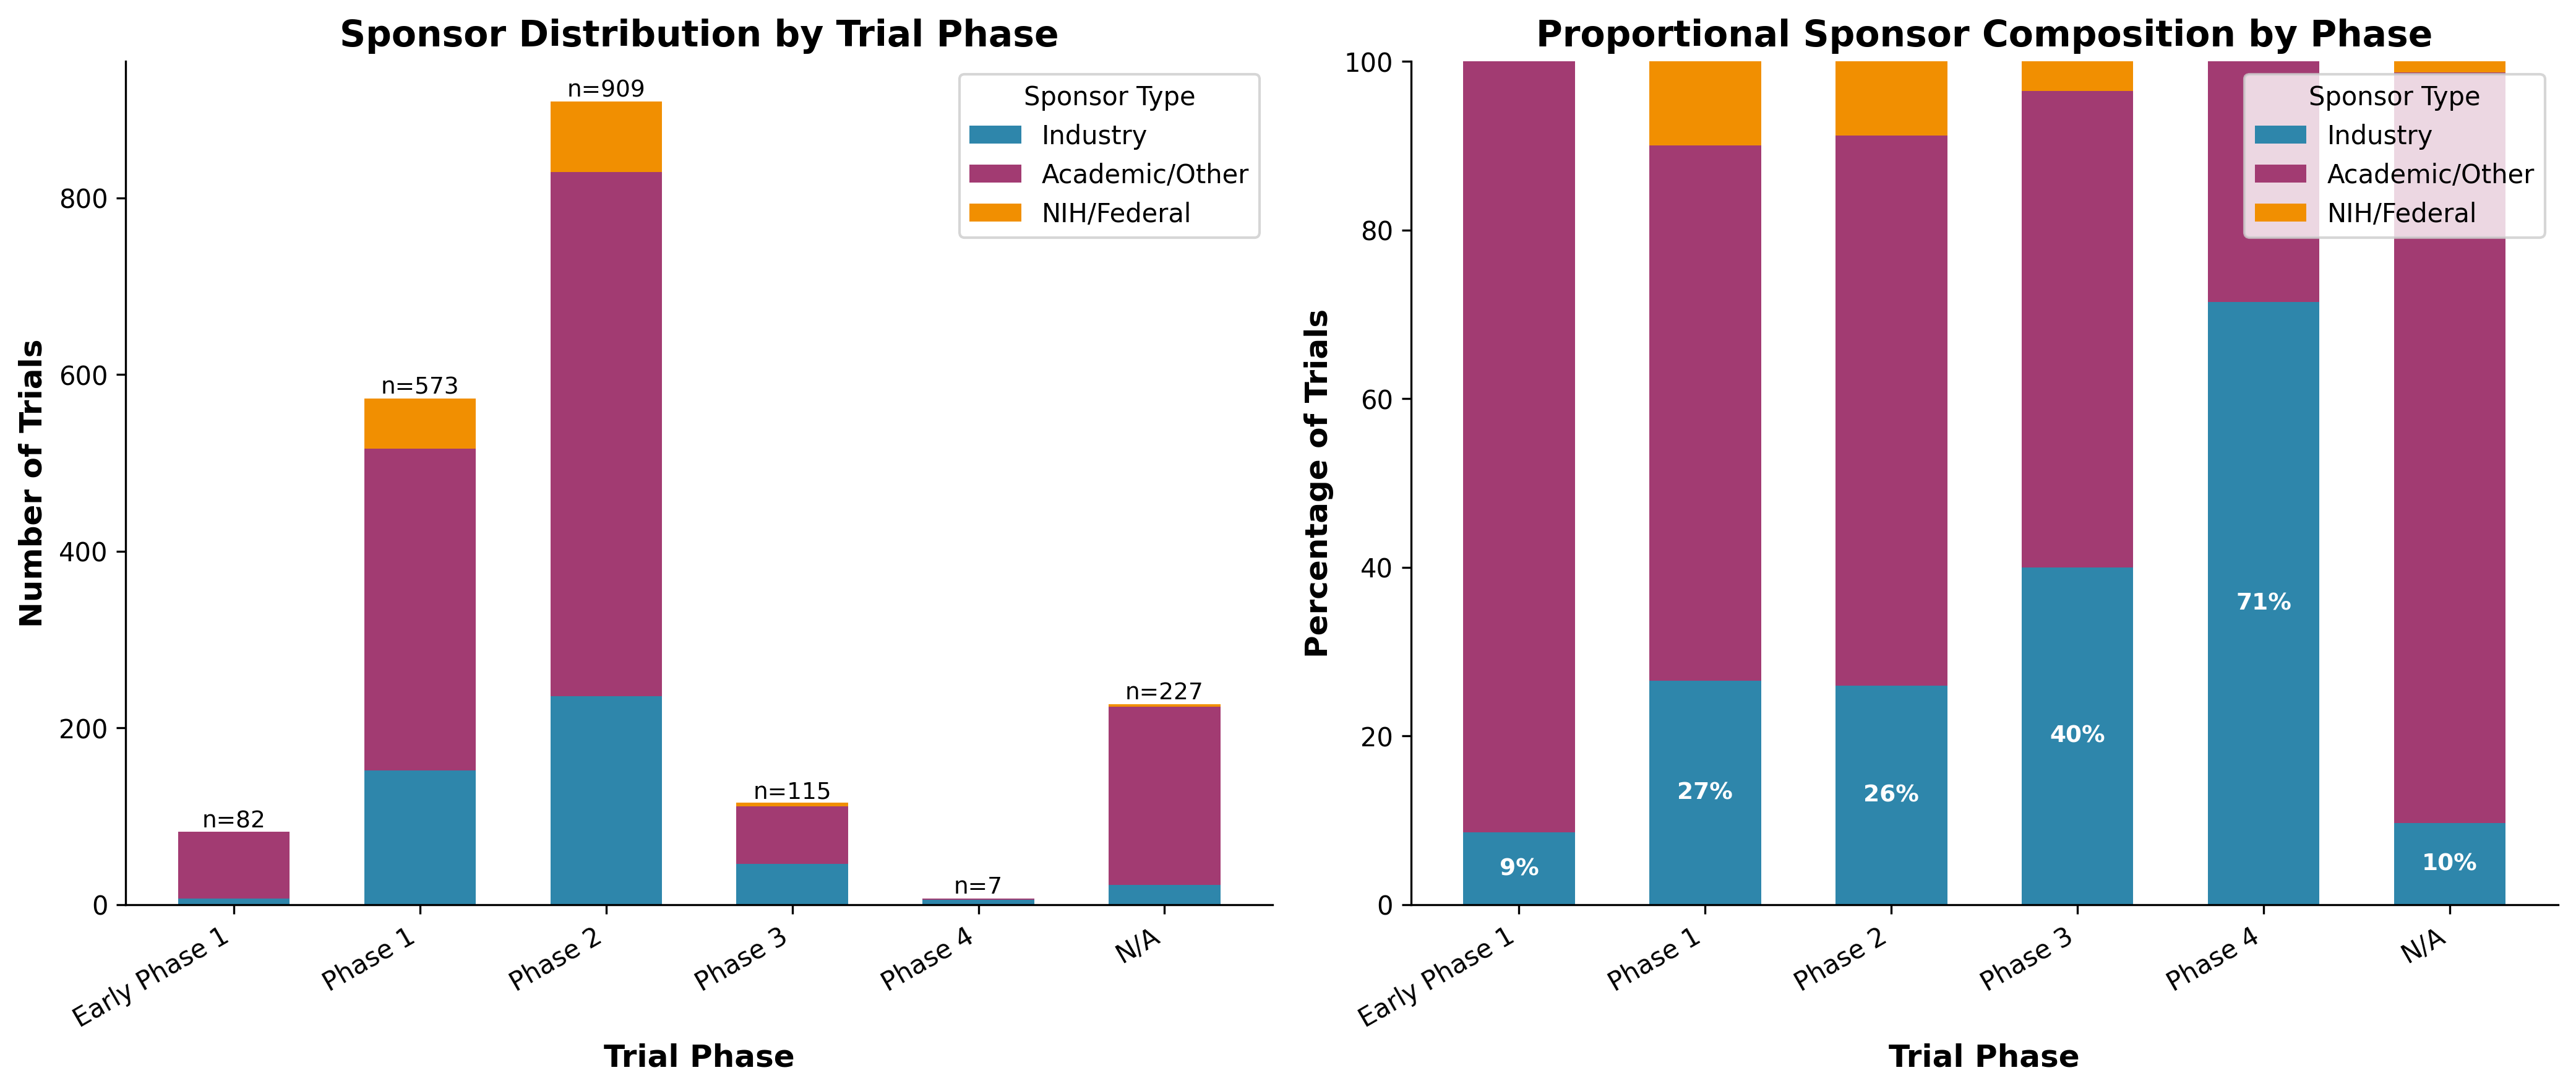
Figure 3: Sponsor distribution by trial phase. Industry dominates late-stage development.
Key Takeaways
What does this analysis mean for researchers, clinicians, and investors?
- Immunotherapy isn't dead, but needs reinvention. Combination approaches, CAR-T cells, and tumor-treating fields represent promising pivots.
- Phase 2 design is critical. Better biomarker selection and adaptive trial designs could reduce attrition.
- Watch emerging targets: MET (363 trials), IDH mutations (37 trials), and TERT promoter mutations (8 trials) show growing consensus.
- Funding gaps create opportunities. Novel mechanisms need new funding models to cross the Phase 2 valley.
Get the Full Analysis
This blog post summarizes key findings from our comprehensive GBM clinical trial landscape analysis.
The full report includes:
- Complete analysis of all 1,913 GBM trials
- Detailed mechanism-of-action breakdowns
- Novel target risk scoring methodology
- Interactive data visualizations
Generated using K-Dense Web (k-dense.ai)
Questions? Contact us at contact@k-dense.ai