Implantable Cardioverter Defibrillators detect and correct dangerous heart rhythms. When they fail, patients can die. Understanding how and why they fail - and whether some manufacturers' devices fail more than others - matters enormously for patient safety and regulatory oversight.
This is a case study of K-Dense Web running a complete post-market surveillance analysis on 10,000 adverse event reports from the FDA's MAUDE database. The goal: find statistically significant failure patterns across manufacturers, without knowing in advance what those patterns would look like.
The challenge: making sense of passive surveillance data
The FDA's Manufacturer and User Facility Device Experience (MAUDE) database contains millions of medical device adverse event reports. Getting useful signal out of it is harder than it looks:
- Reports are narrative text, not structured data, so you need NLP before you can count anything
- There's no standard taxonomy of failure modes; you have to infer them from descriptions
- Comparing across manufacturers requires proper statistics, not just eyeballing percentages
- The most interesting findings often don't match predefined categories
The pipeline
With a single prompt describing the research objective, K-Dense Web designed and ran a five-step analysis.
Step 1: Data acquisition
K-Dense Web queried the openFDA Device Adverse Events API, pulled 10,000 ICD-related reports from April-July 2020, and parsed the narrative text fields for downstream analysis. The dataset covered 37 unique manufacturers.
Step 2: Hybrid text categorization
The analysis ran two approaches in parallel.
First, keyword matching against 8 predefined failure categories: lead fracture, lead dislodgement, infection, inappropriate shock, battery depletion, recall-related events, general malfunction, and patient death. This captured 67.6% of events.
The other 32.4% went to NLP.
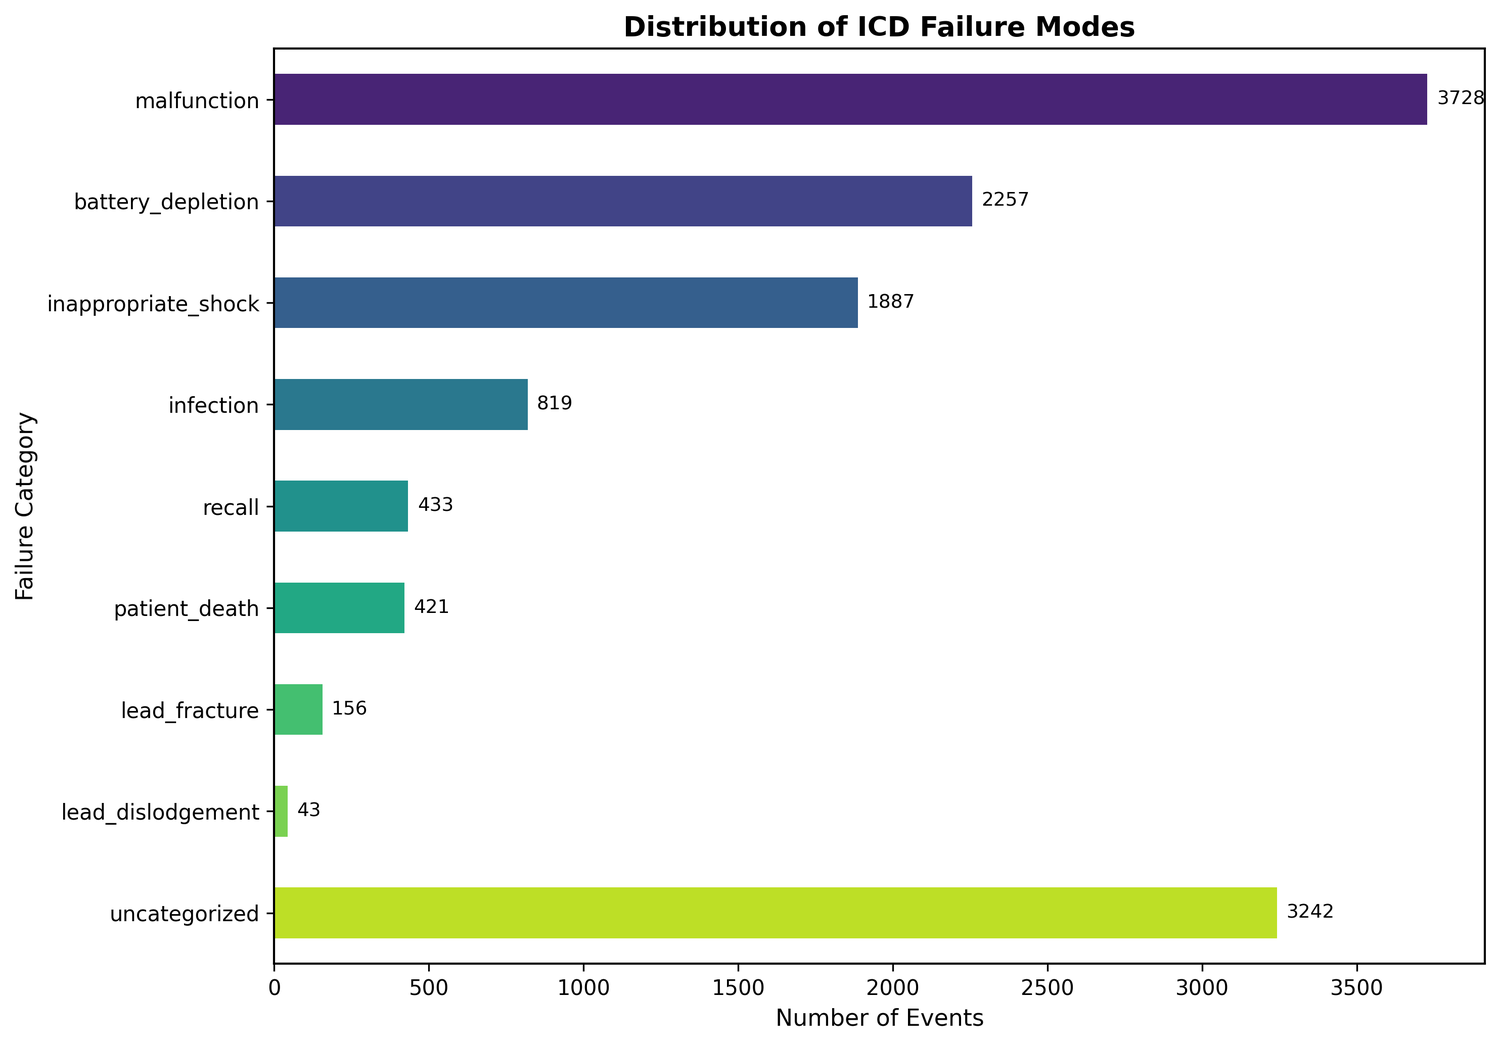
| Failure Mode | Events | Percentage |
|---|---|---|
| Malfunction | 3,728 | 37.3% |
| Battery Depletion | 2,257 | 22.6% |
| Inappropriate Shock | 1,887 | 18.9% |
| Infection | 819 | 8.2% |
| Recall | 433 | 4.3% |
| Patient Death | 421 | 4.2% |
| Lead Fracture | 156 | 1.6% |
| Lead Dislodgement | 43 | 0.4% |
Step 3: NLP topic modeling
For the uncategorized third of the dataset, K-Dense Web ran unsupervised topic modeling: LDA with 12 topics, NMF with 12 topics for cross-validation, and n-gram analysis for bigrams and trigrams.
Four failure modes emerged that keyword searches had missed entirely:
- Software/firmware issues (1,371 events): software flags, firmware malfunctions, signal processing errors - a distinct category that collapses into "malfunction" under keyword search but has a different root cause
- Electrode belt failures (2,288 mentions): mostly ZOLL LifeVest wearable components, which are a different problem than implanted device failures
- Skin irritation/biocompatibility issues (686 mentions): patient tolerance problems with device materials
- Lead impedance anomalies: subtle electrical issues that tend to precede mechanical lead failures
Step 4: Statistical analysis
Chi-square test on the full dataset (statistic: 7,075.88, p < 0.0001, Cramer's V: 0.268) confirmed that failure mode distributions differ substantially across manufacturers - that's a medium-to-large effect size, not noise.

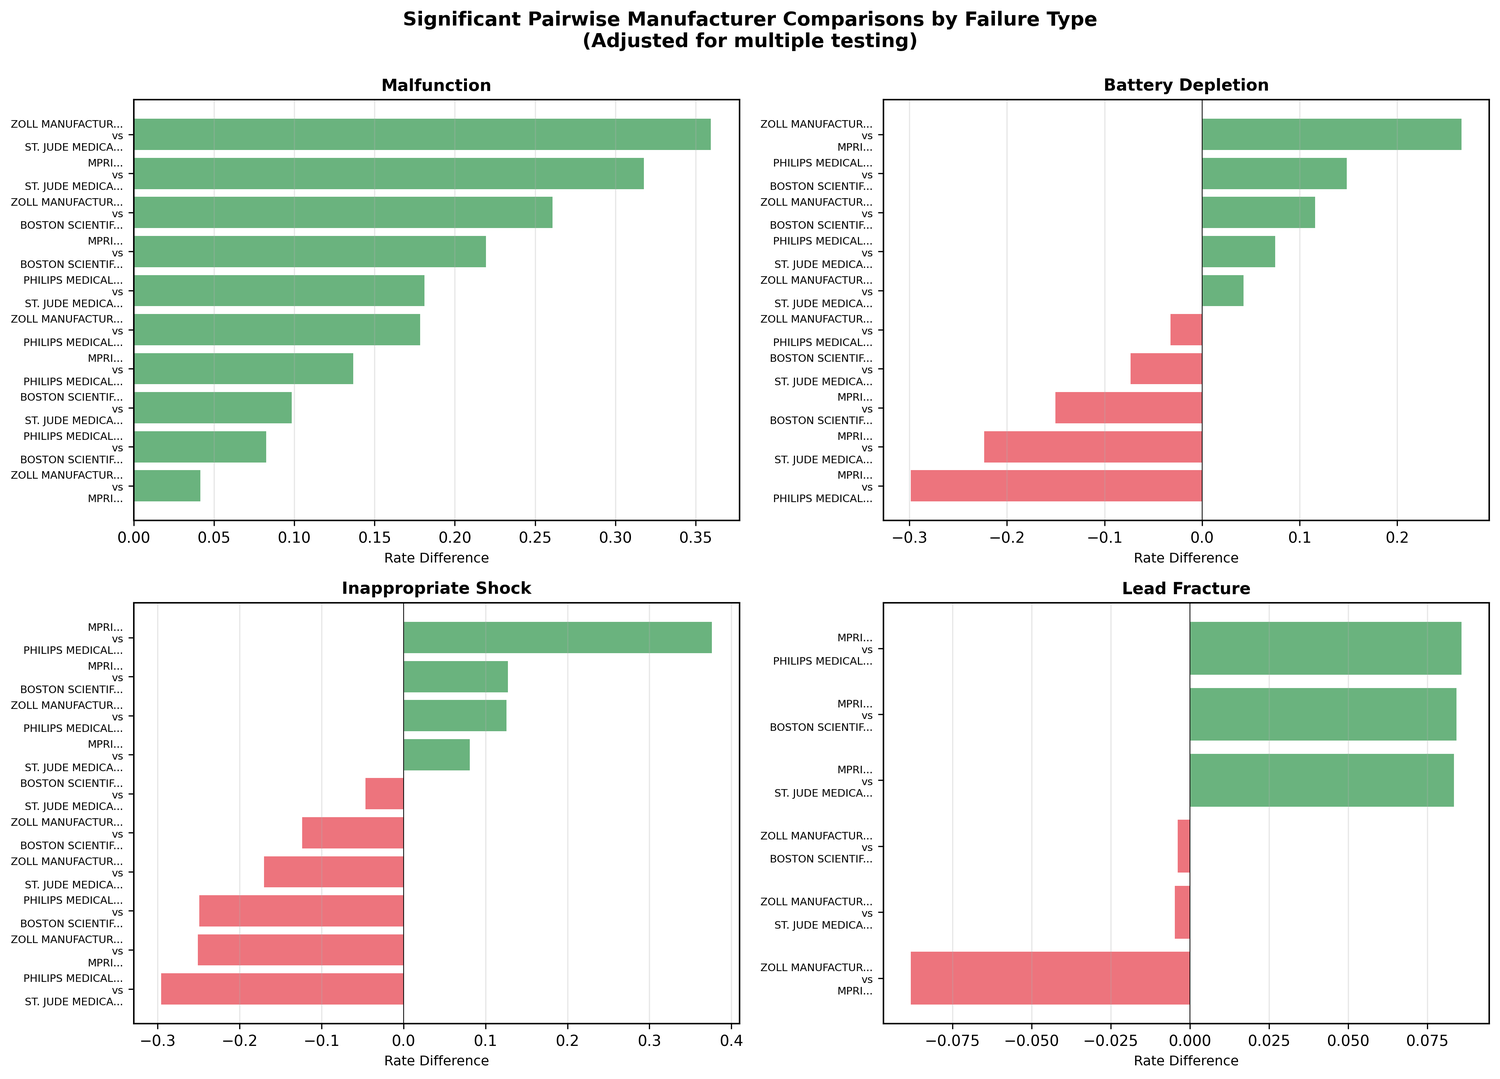
Pairwise comparisons with FDR correction revealed some extreme numbers:
| Comparison | Failure Mode | Odds Ratio | p-value |
|---|---|---|---|
| ZOLL vs St. Jude | Malfunction | 9.52× higher | < 0.001 |
| ZOLL vs MPRI | Battery Depletion | 64× higher | < 0.001 |
| MPRI vs Philips | Lead Fracture | 42.8× higher | < 0.001 |
| Philips vs Others | Inappropriate Shock | ~0% (vs 18.9% avg) | < 0.001 |
A 64× odds ratio isn't a marginal difference. These are order-of-magnitude gaps in failure profiles between devices that are often treated as interchangeable.
Step 5: Visualization and reporting
K-Dense Web generated six figures for the final report.
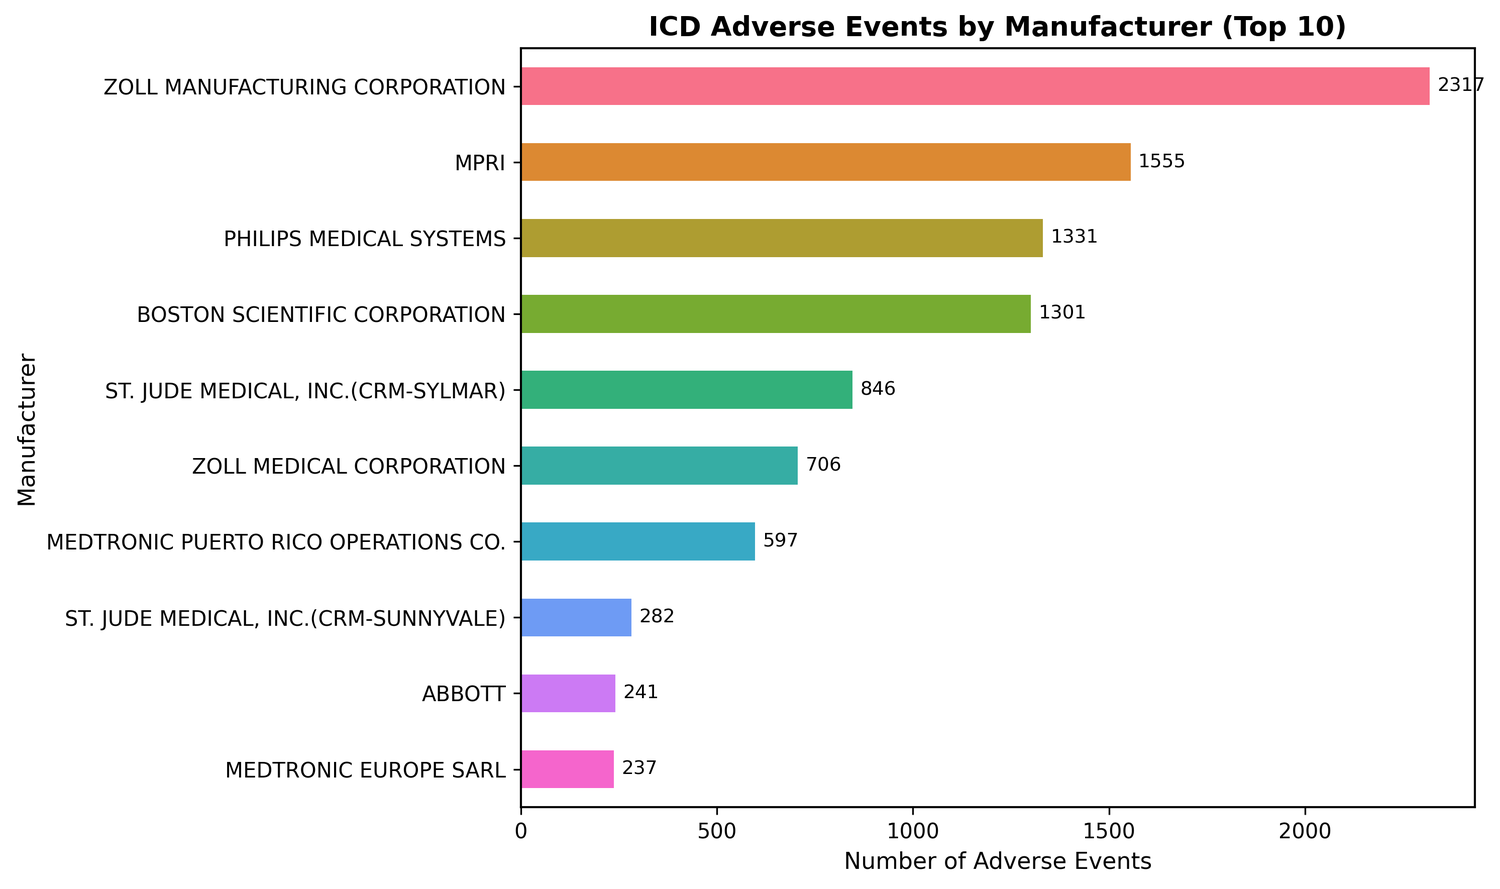
Five manufacturers account for 73% of reported events:
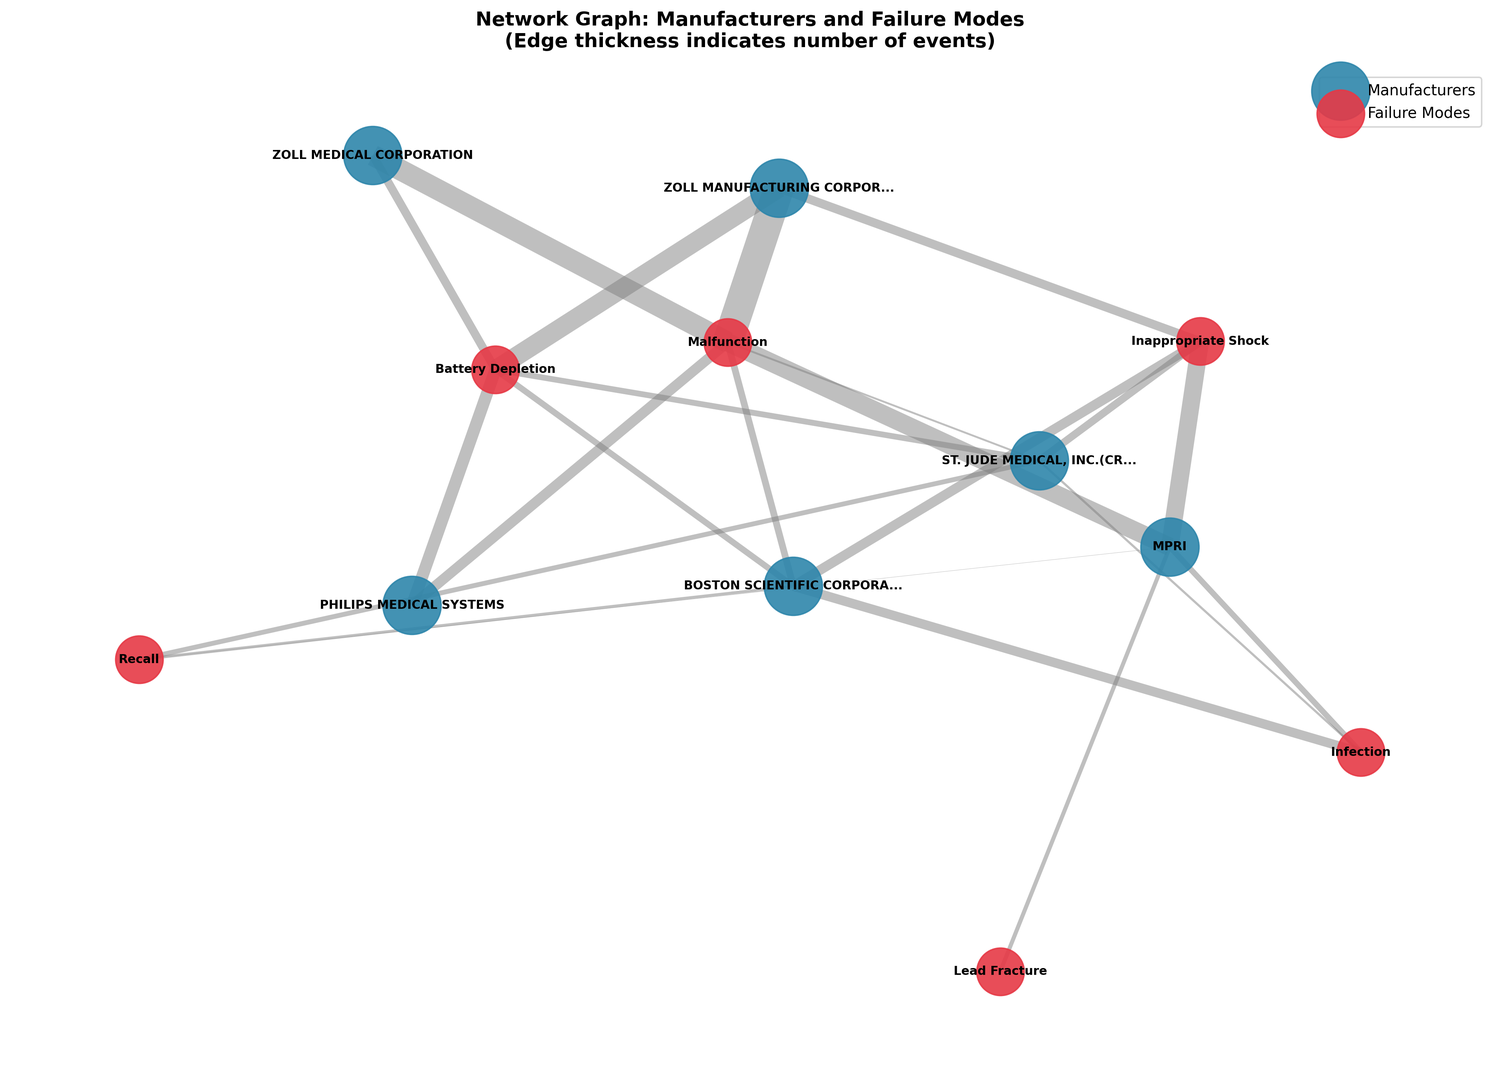
The bipartite network graph maps manufacturer-failure associations:
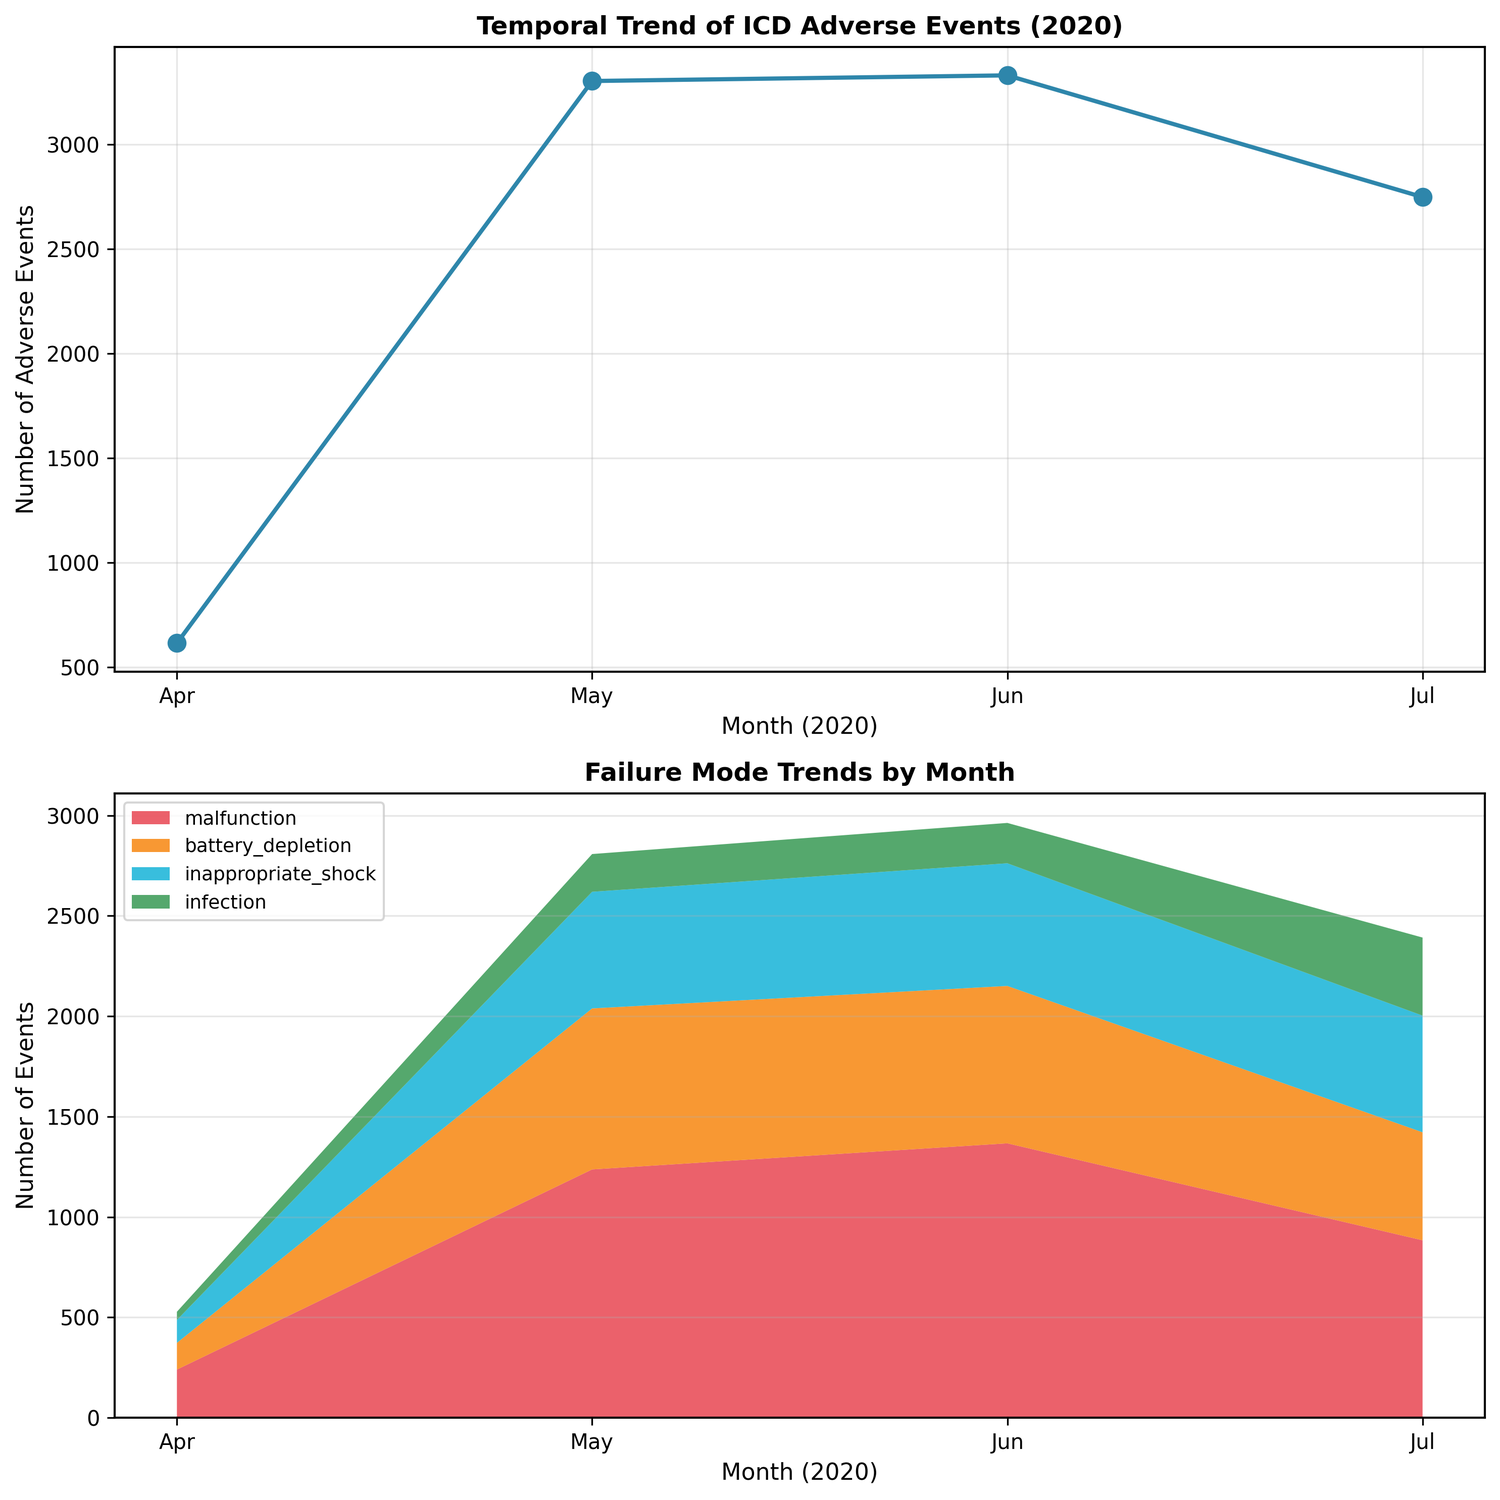
66% of events clustered in May-June 2020 - possibly COVID-19 reporting patterns, possibly specific recall activity:
What the data shows
The chi-square test isn't just statistically significant at some arbitrary threshold - the Cramer's V of 0.268 says these differences are large enough to reflect genuine variation in device design and manufacturing, not reporting quirks.
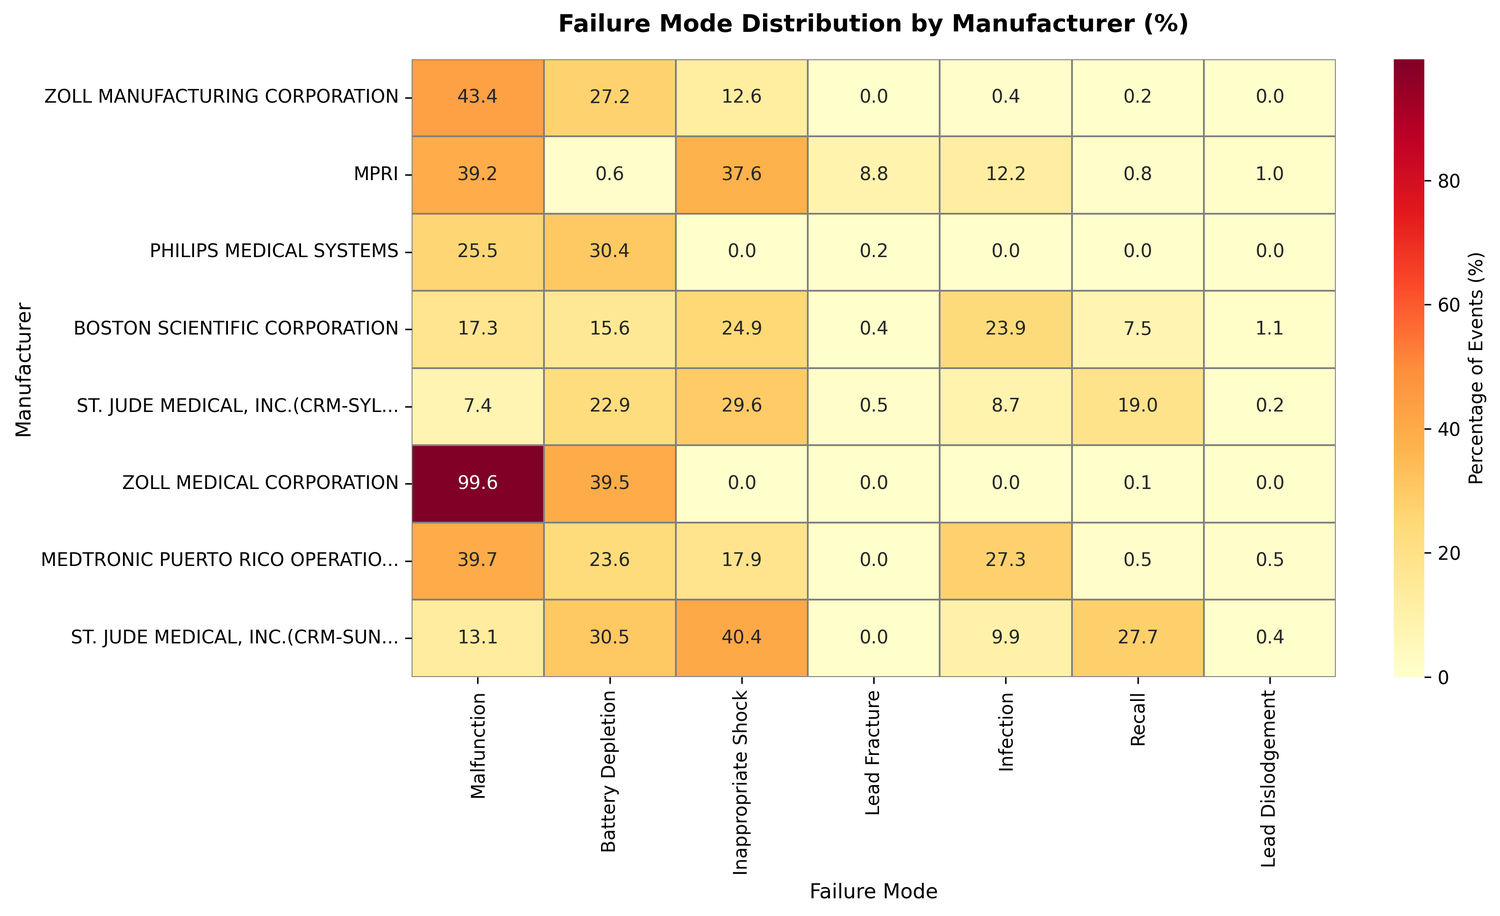
The per-manufacturer profiles make that concrete:
- ZOLL Manufacturing: 43.4% malfunction rate, 27.2% battery depletion
- MPRI: 8.8% lead fracture rate, versus under 0.5% for everyone else; only 0.6% battery depletion
- Philips Medical Systems: 0% inappropriate shocks against a dataset average of 18.9%, but 30.4% battery depletion
- ZOLL Medical Corporation: 99.6% malfunction rate, the highest in the dataset
Software is probably an underreported failure category. Keyword searches for "malfunction" don't separate software bugs from mechanical failures. The NLP analysis suggests a meaningful slice of what gets logged as malfunction is actually firmware or signal processing issues - which have different root causes and different fix paths.
The electrode belt findings are almost entirely about ZOLL LifeVest, a wearable device. Mixing those into a general "ICD failure" analysis would dilute the picture for both wearable and implanted device safety signals.
What this means in practice
For clinicians, the manufacturer-specific profiles matter at the point of device selection. A 9.52× higher malfunction odds ratio isn't something to ignore for high-risk patients where monitoring protocols and follow-up frequency depend partly on known failure modes.
For regulators, automated NLP surveillance can surface emerging signals much faster than manual chart review. Manufacturer-level benchmarking also makes it easier to target investigations rather than casting wide nets.
For manufacturers, the findings cut both ways. Philips' zero inappropriate shock rate is notable, even if their battery depletion rate is high. The data shows where devices underperform relative to competitors, but also where they have a better profile.
Results summary
| Metric | Value |
|---|---|
| Total events analyzed | 10,000 |
| Unique manufacturers | 37 |
| Failure categories | 8 predefined + NLP-discovered |
| NLP topics identified | 12 |
| Chi-square significance | p < 0.0001 |
| Effect size (Cramer's V) | 0.268 |
| Maximum odds ratio | 64× (battery depletion) |
| Pipeline execution time | ~30 minutes |
Technical details
Statistical methods: chi-square test for manufacturer-failure independence, Fisher's exact test for pairwise comparisons, Benjamini-Hochberg FDR correction, Cramer's V for effect size.
NLP methods: TF-IDF vectorization with bigram extraction, LDA (12 topics, probabilistic), NMF (12 topics, deterministic cross-validation), with lowercasing, stopword removal, and length filtering in preprocessing.
Visualization: matplotlib and seaborn, NetworkX for network analysis, colorblind-accessible palettes (Okabe-Ito, Viridis).
Limitations
This dataset covers only four months (April-July 2020). There's no denominator data, so true failure rates adjusted for market share aren't calculable. Passive surveillance has inherent reporting bias - not every adverse event gets reported. And the manufacturer differences don't explain themselves; association isn't causation.
Extensions worth pursuing: multi-year analysis (2018-2024), denominator data for rate-based comparisons, linking to the FDA recall database for temporal clustering, and predictive modeling for earlier signal detection.
Run it yourself
Traditional post-market surveillance like this requires familiarity with the openFDA API, NLP skills, statistical knowledge for multiple comparison problems, and usually days to weeks of work. K-Dense Web ran the full pipeline in about 30 minutes.
This case study was generated from K-Dense Web. View the complete example session including all analysis code, data files, and figures. Download the full 34-page Technical Report (PDF) suitable for regulatory submission or academic publication.