Pancreatic ductal adenocarcinoma (PDAC) has a 5-year overall survival rate of just 8-10%, and nearly 80% of patients who undergo curative surgery will relapse. Checkpoint inhibitors have transformed outcomes in melanoma, lung cancer, and dozens of other malignancies, but PDAC has been almost entirely resistant. The tumor is immunologically cold: low mutational burden, a dense desmoplastic stroma that walls off T cells, and an aggressive immunosuppressive microenvironment.
This is why individualized neoantigen-specific immunotherapy (iNeST) has become one of the most closely watched strategies in pancreatic cancer. BioNTech and Genentech's autogene cevumeran, an mRNA vaccine encoding up to 20 patient-specific neoantigens, showed striking Phase 1 results: 8 of 16 patients with resected PDAC mounted durable T cell responses persisting over 3 years, and vaccine responders had a 3-year recurrence-free survival of 75% compared to just 12.5% for non-responders (HR 0.14, p = 0.007). The randomized Phase 2 trial IMCODE003 (NCT05968326, n=260) is now recruiting to test whether this translates into a disease-free survival benefit at scale.
But designing the next generation of neoantigen vaccines for PDAC requires answering a chain of connected questions. How many targetable neoantigens does a typical PDAC patient actually carry? Which mutations are immunogenic? Are the key neoepitopes structurally accessible for MHC-I presentation? What does the tumor microenvironment do to block vaccine-primed T cells? And how do the current clinical trials compare in their approaches?
In this case study, K-Dense Web answered all of these questions in a single autonomous session. It queried 6 live databases, wrote and executed 6 Python scripts, analyzed 748 patient samples across 3 cancer types, generated 9 publication-quality figures, and produced a 36-slide presentation with actionable recommendations for iNeST optimization.
The Pipeline
K-Dense Web designed a 6-step computational workflow that moves from raw genomic data to clinical strategy:
- Genomic Data Acquisition & TMB Profiling (cBioPortal API, 3 TCGA cohorts, 748 samples)
- Neoantigen Landscape & Oncoplot (22,409 mutations, UniProt domain mapping, immunogenic scoring)
- KRAS Structural Modeling (PDB structures, Shrake-Rupley SASA, 3D visualization)
- Clinical Trial & Literature Synthesis (ClinicalTrials.gov, PubMed, 67 articles)
- Tumor Microenvironment & Pathway Analysis (Open Targets GraphQL API, druggability ranking)
- Neoantigen Filtering Pipeline (Sankey diagram quantifying per-patient attrition)
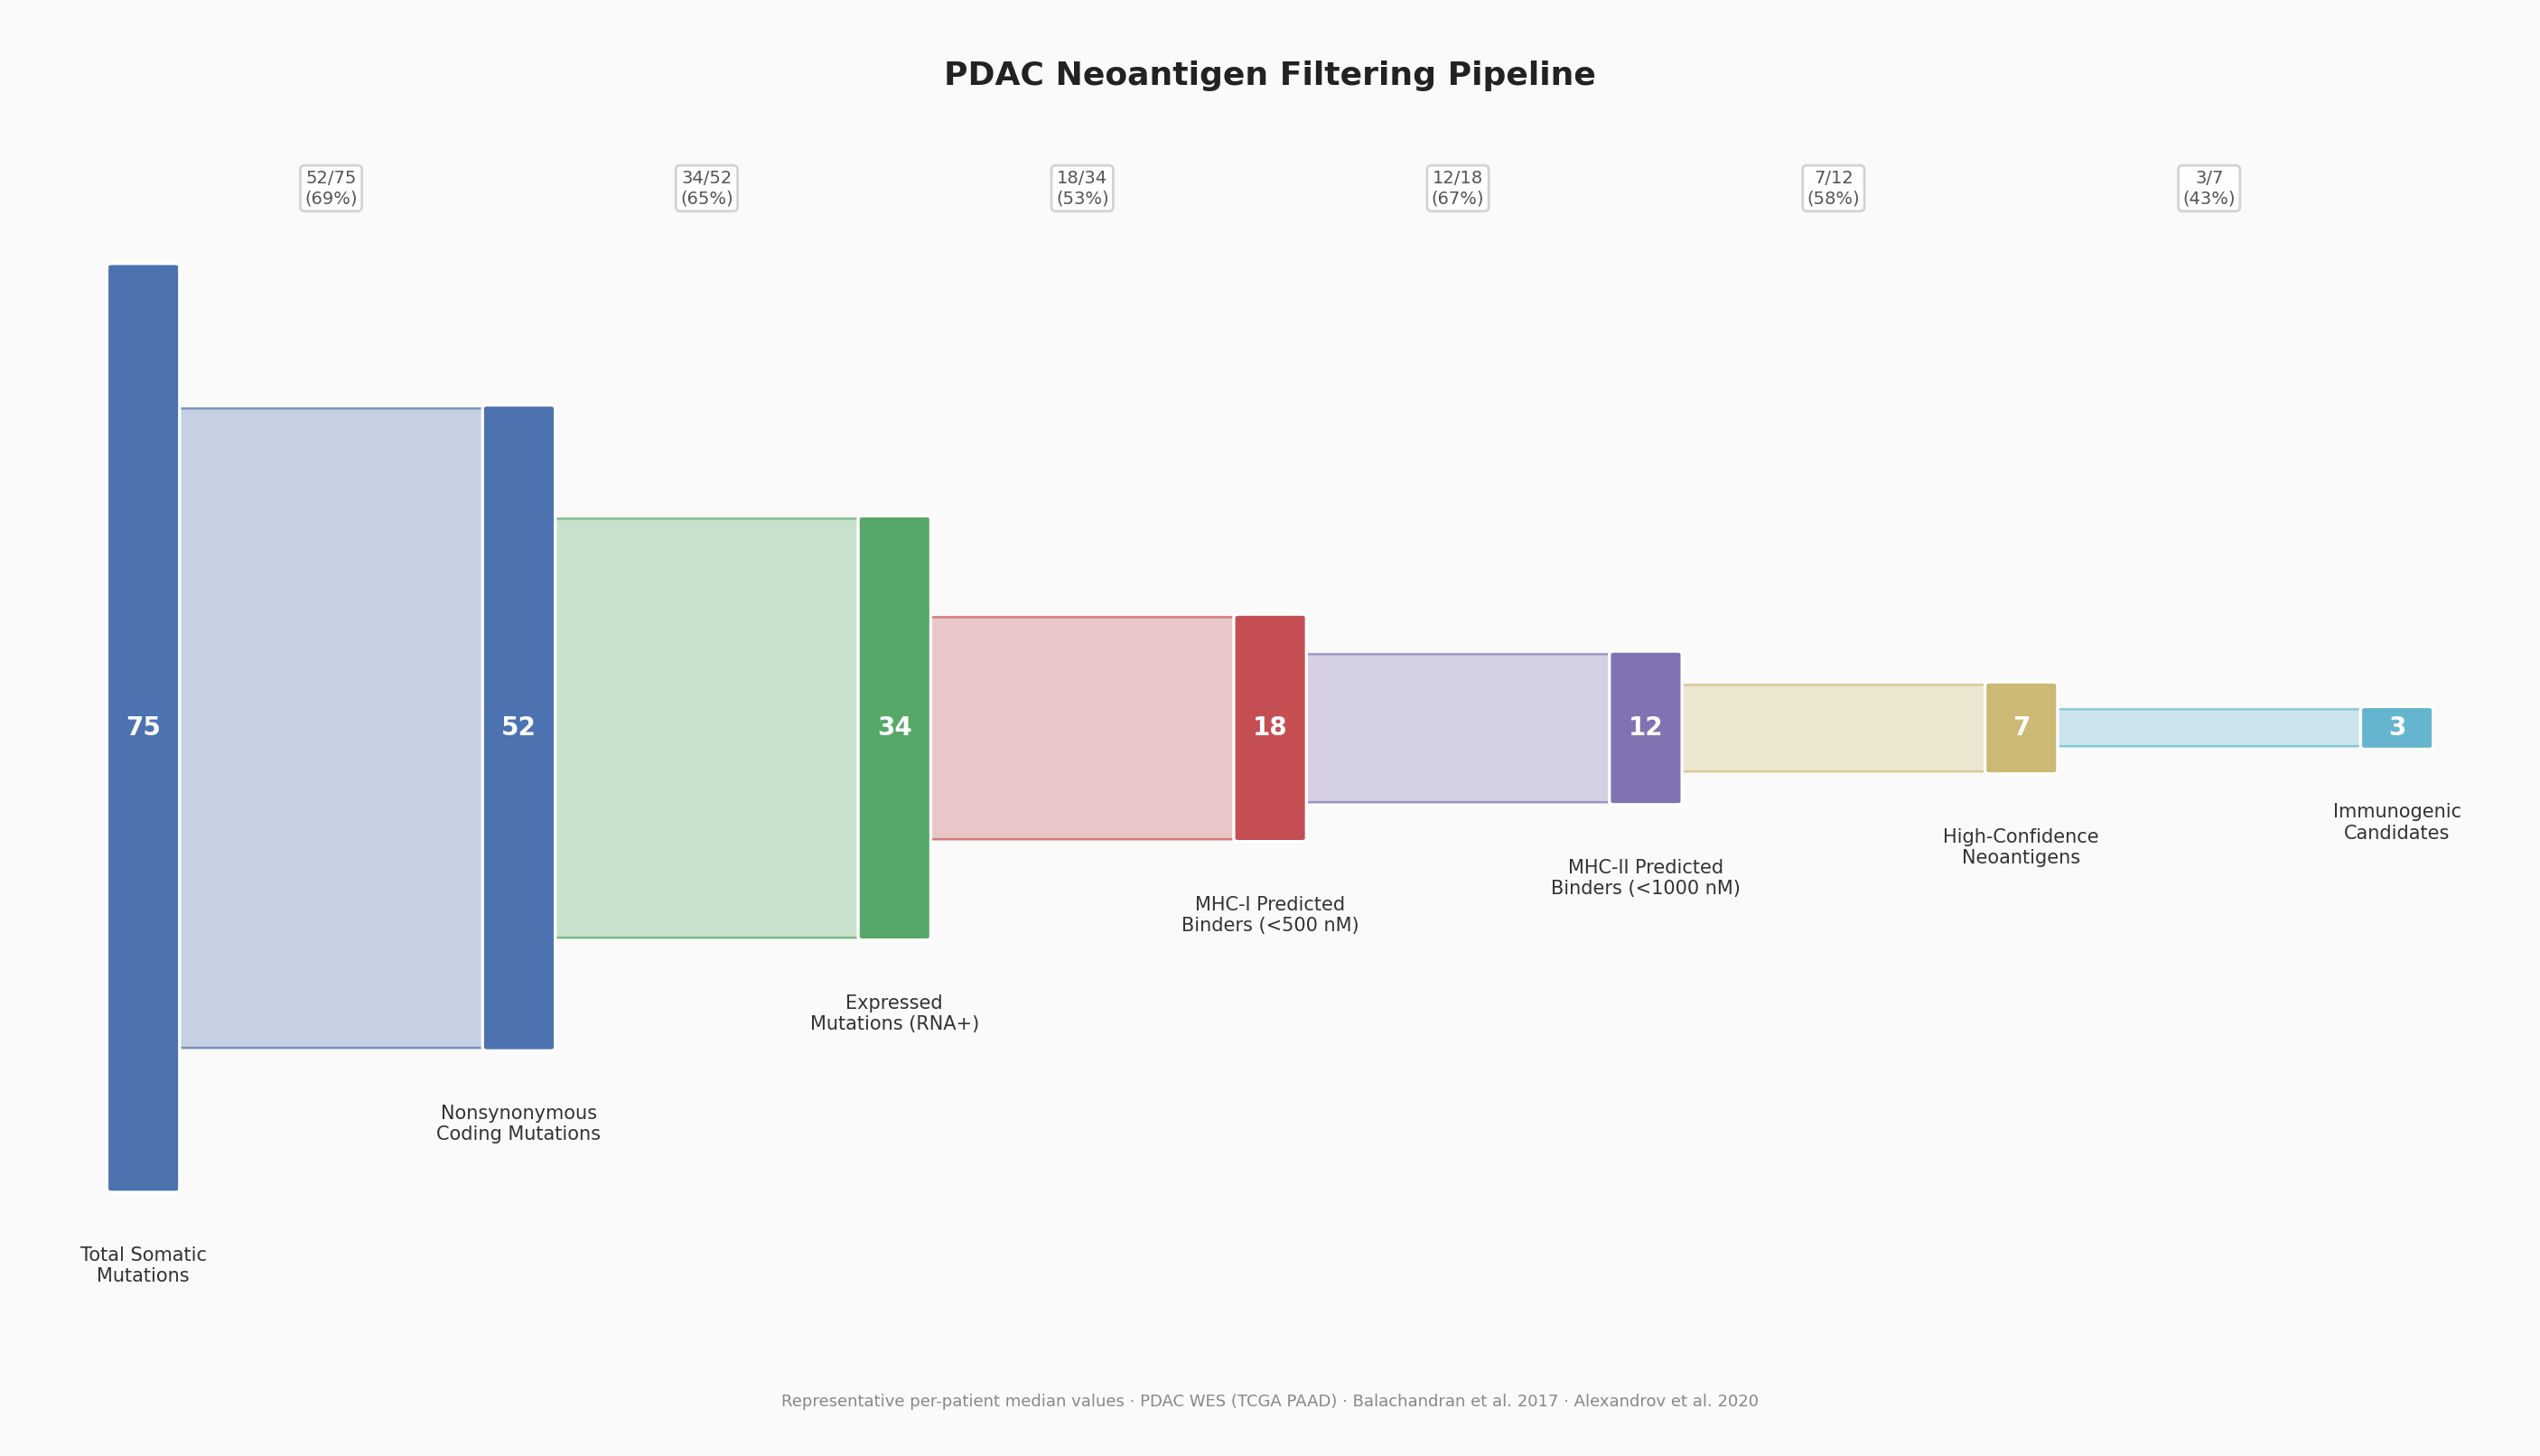
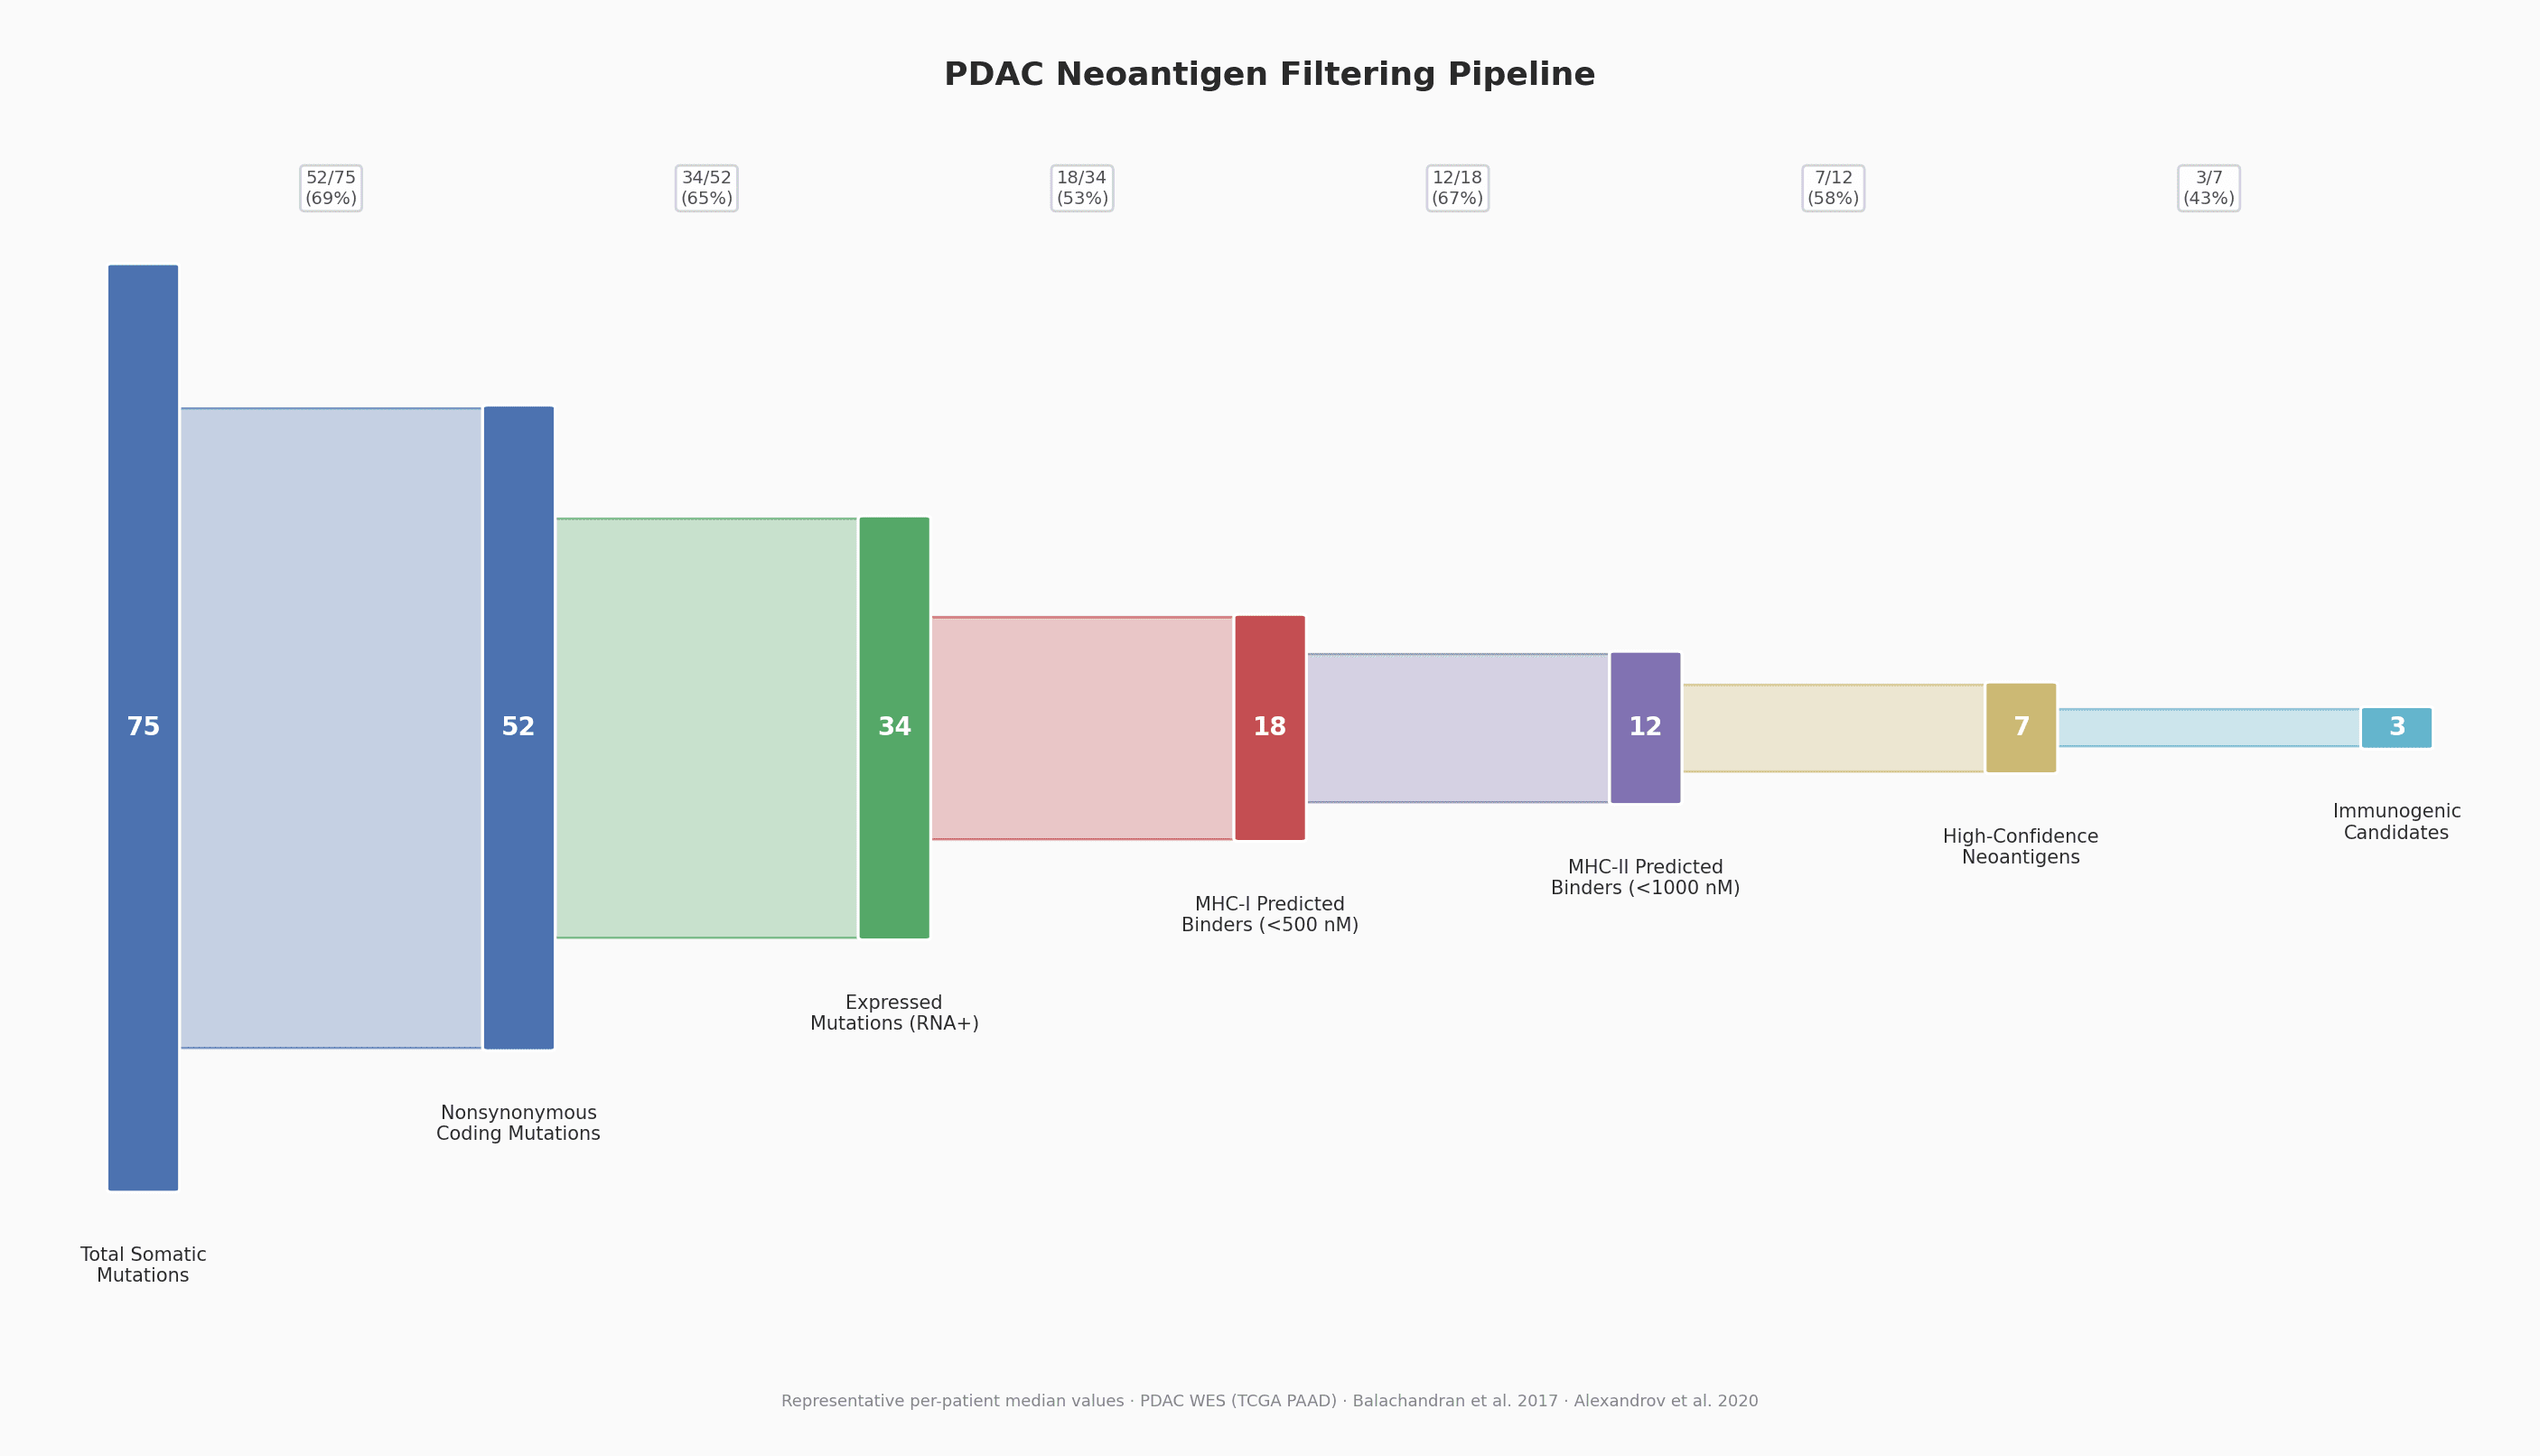
Neoantigen filtering pipeline: a typical PDAC patient's 75 somatic mutations are filtered through coding, expression, MHC-I binding, MHC-II binding, confidence, and immunogenicity criteria, leaving just 3 actionable candidates (4% retention).
Every step was autonomous. K-Dense Web chose the APIs, designed the statistical tests, applied appropriate corrections, and generated all figures and data tables without manual intervention.
TMB: The Core Challenge
The first question any neoantigen vaccine program must confront is whether there are enough mutations to target. Tumor mutational burden (TMB) directly determines the raw material available for neoantigen discovery.
K-Dense Web queried the cBioPortal API for three TCGA cohorts and computed TMB (mutations per megabase, exome size = 38 Mb):
| Cancer Type | N | Median TMB (mut/Mb) | Mean TMB |
|---|---|---|---|
| PDAC | 150 | 1.21 | 3.93 |
| Melanoma | 368 | 7.61 | 13.61 |
| NSCLC (LUAD) | 230 | 4.09 | 6.09 |
The differences are stark and statistically unambiguous (Kruskal-Wallis H = 224.64, p = 1.66 x 10^-49). PDAC carries roughly 6x fewer mutations per megabase than melanoma and 3x fewer than lung adenocarcinoma. Fewer than 2% of PDAC patients qualify as TMB-high (>10 mut/Mb), and MSI-high prevalence is below 1%.
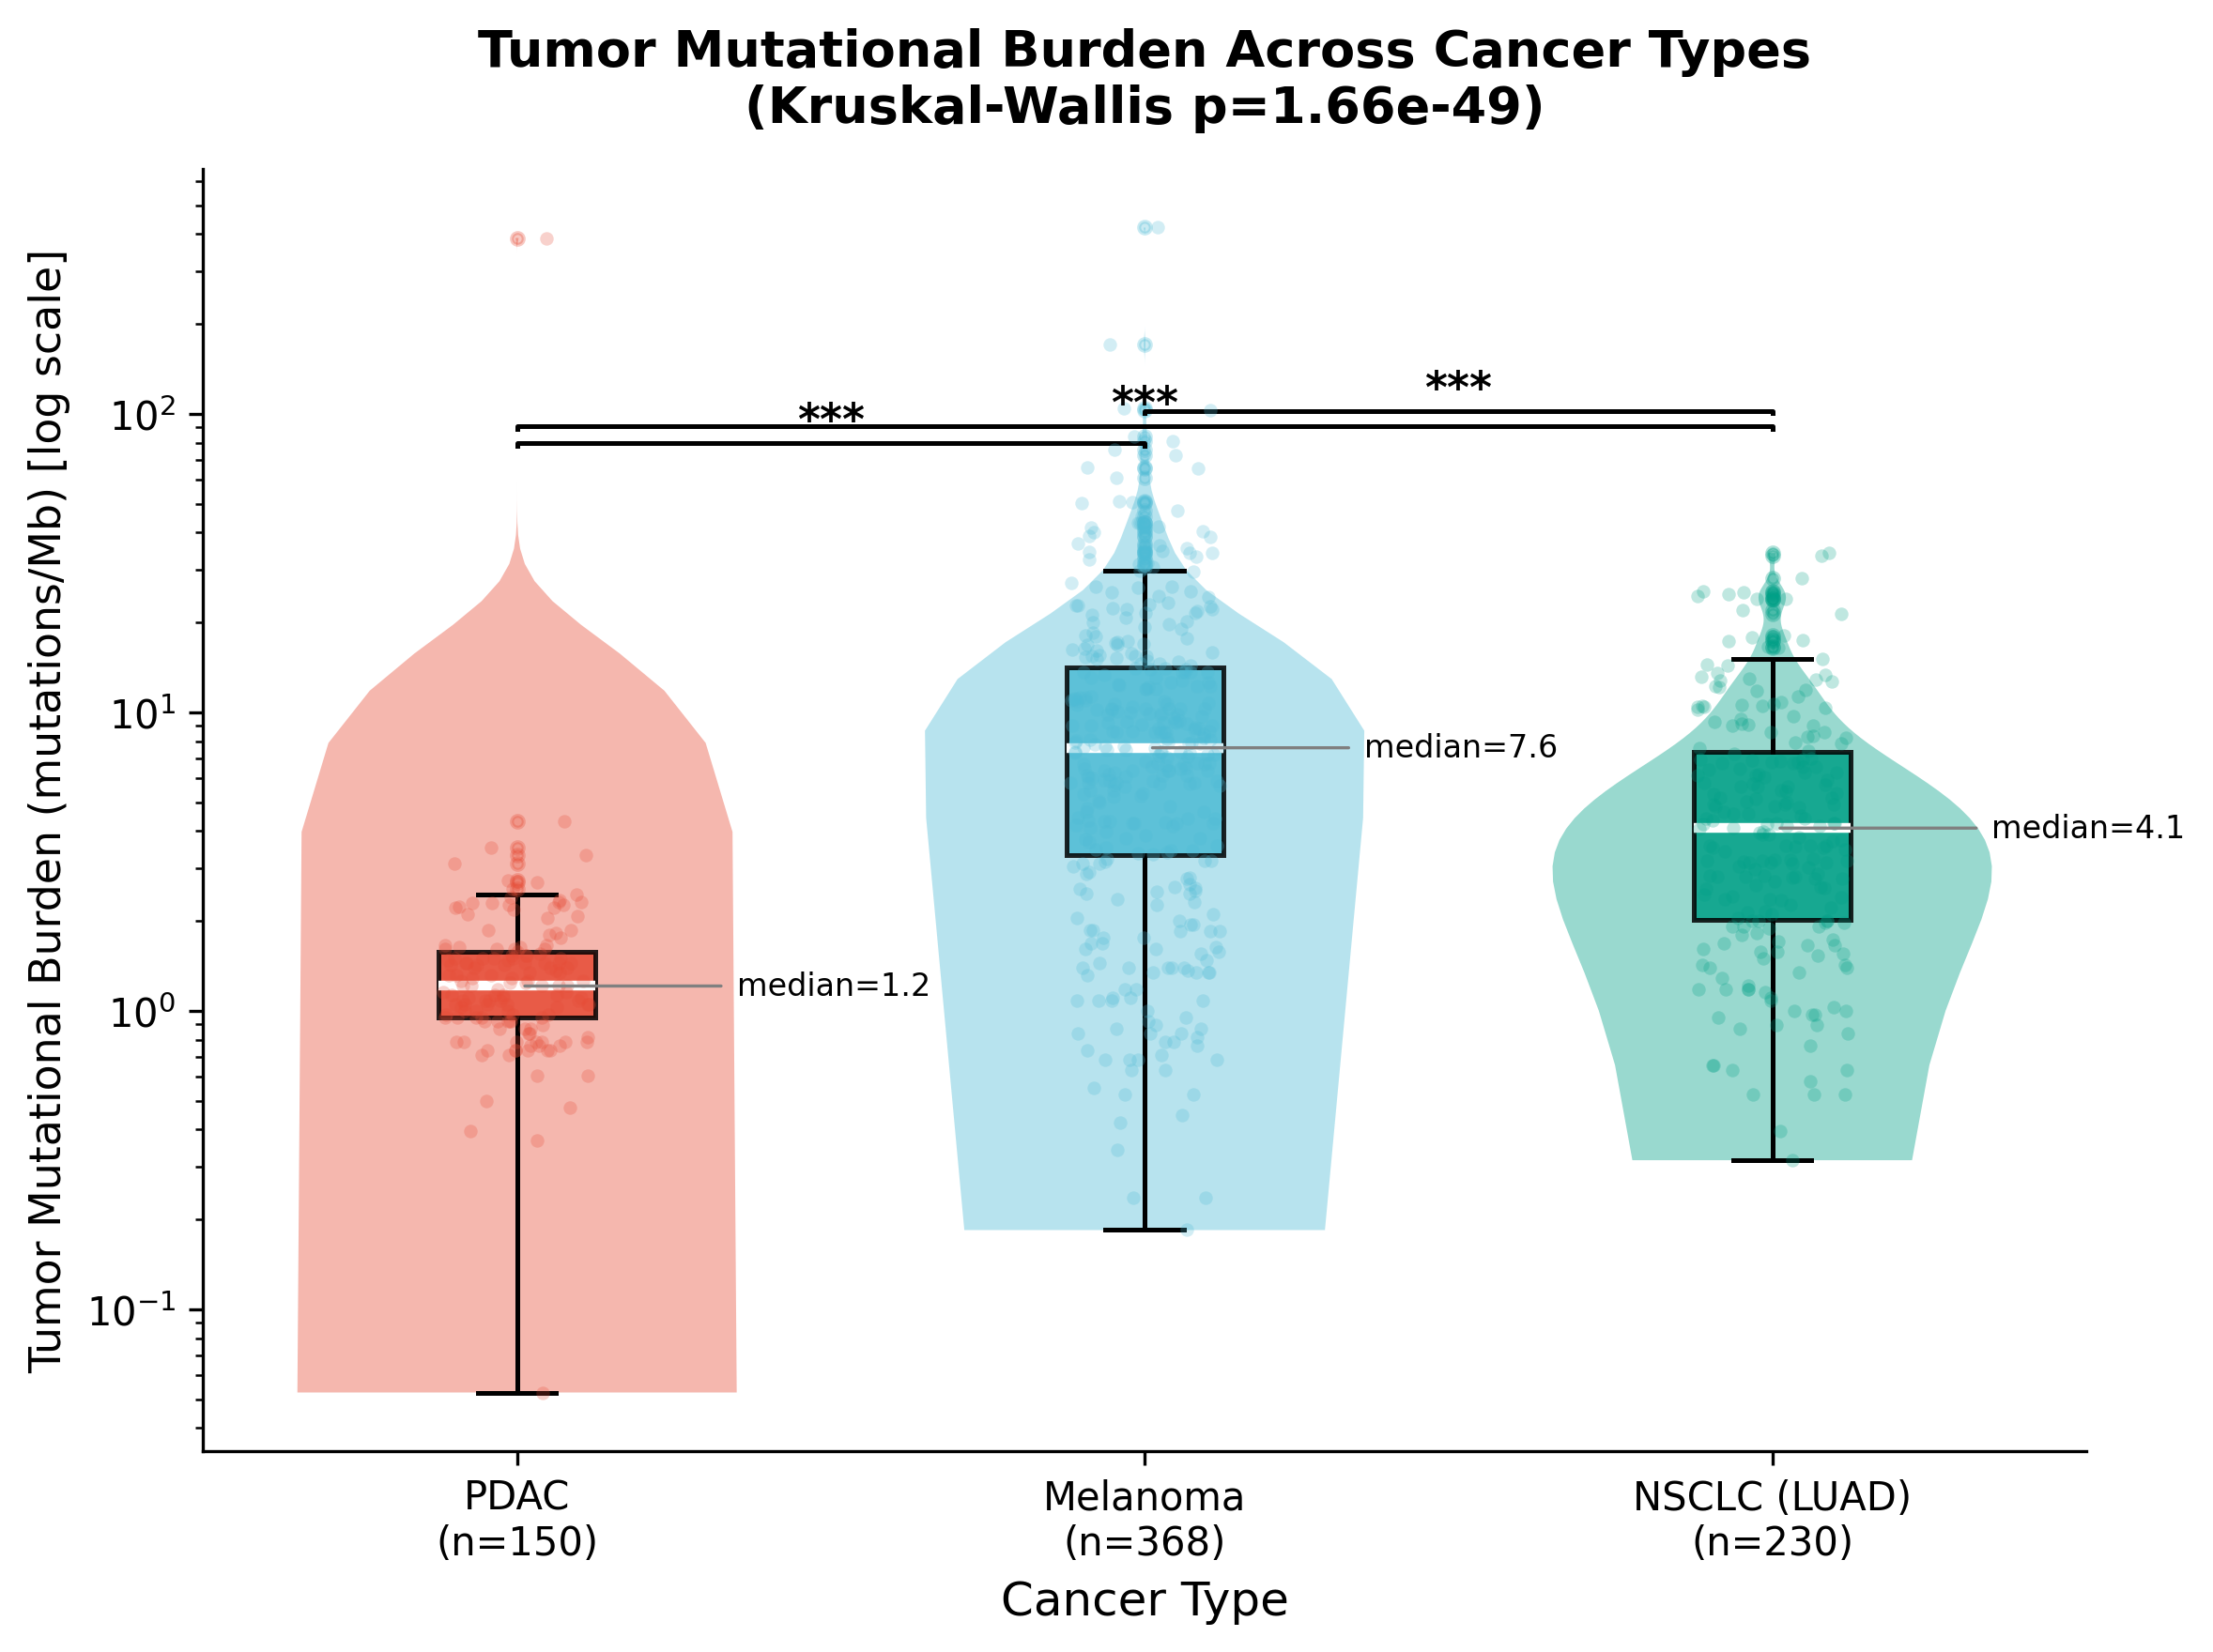
TMB comparison across TCGA cohorts (n=748). PDAC's median of 1.2 mut/Mb is significantly lower than both melanoma (7.6) and NSCLC (4.1), with all pairwise comparisons reaching p < 10^-9 after Bonferroni correction.
This is exactly why neoantigen quality, not quantity, must drive the vaccine design strategy for PDAC.
Mutational Landscape: 22,409 Mutations Across 150 Patients
Despite its low TMB, PDAC has a highly concentrated mutational landscape dominated by a small number of recurrent driver genes. K-Dense Web retrieved all non-silent mutations from the TCGA PAAD cohort (n=150) and identified the top 30 most frequently mutated genes.
| Rank | Gene | Mutated Samples | Frequency | Immunogenic Score |
|---|---|---|---|---|
| 1 | KRAS | 136 / 150 | 90.7% | 3 |
| 2 | TP53 | 104 / 150 | 69.3% | 3 |
| 3 | SMAD4 | 37 / 150 | 24.7% | 3 |
| 4 | TTN | 35 / 150 | 23.3% | 3 |
| 5 | CDKN2A | 22 / 150 | 14.7% | 2 |
KRAS dominates. Over 90% of PDAC patients carry a KRAS mutation, primarily at the G12 hotspot (G12D at ~45% and G12V at ~35% together account for roughly 80% of PDAC cases). This makes KRAS the single most important neoantigen target in pancreatic cancer, and its near-universal prevalence means a shared antigen strategy could complement individualized approaches.
The immunogenic potential score (0-3) was computed per gene: +1 for missense mutations, +1 for mutations mapping to annotated functional domains, +1 for genes mutated in 3 or more patients. Every gene in the top 30 carried at least one mutation in a UniProt-annotated domain (29/30 had domain annotations), and 100% of PDAC samples harbored at least one mutation in the top-30 gene set.
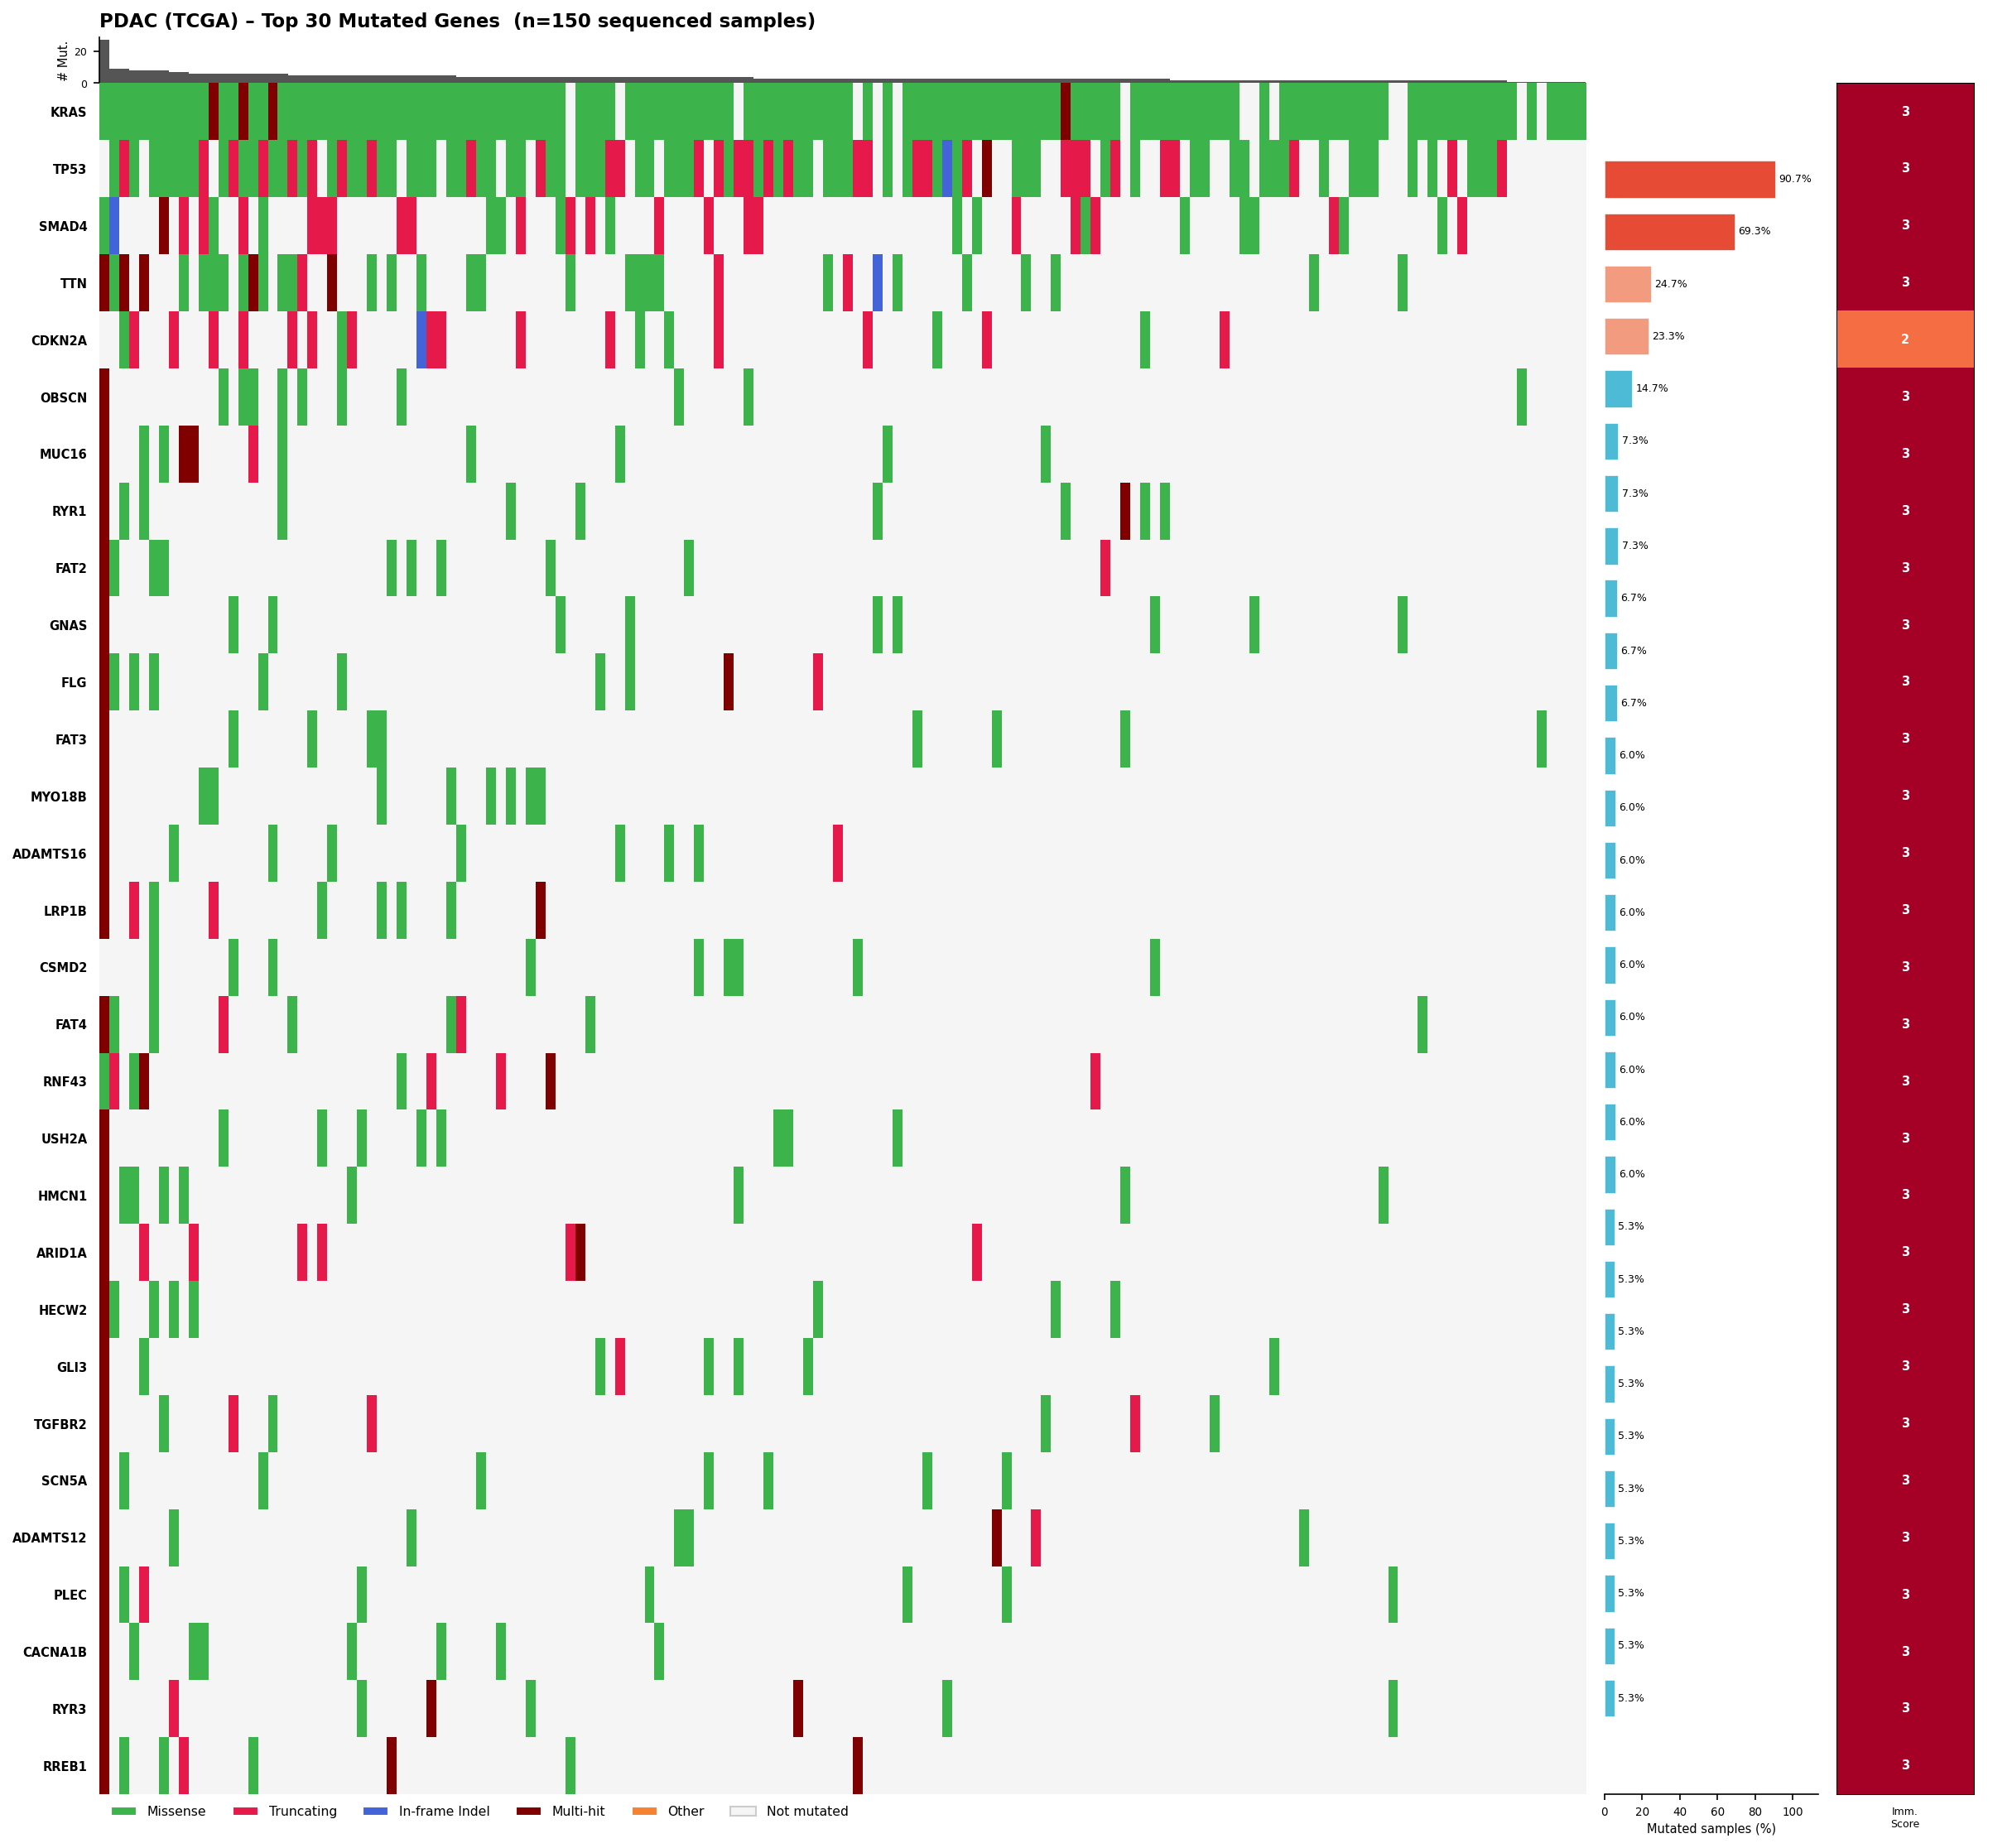
Annotated oncoplot: top 30 mutated genes across 150 TCGA PDAC samples. Green = missense, pink = truncating, blue = in-frame indel, dark red = multi-hit. Right panels show mutation frequency and immunogenic potential scores.
KRAS Structural Analysis: Is G12 Accessible for MHC-I Presentation?
For a mutation to become a vaccine target, the mutant peptide must be processable by the proteasome and presentable on MHC-I molecules. K-Dense Web downloaded three crystal structures from the RCSB PDB (4OBE for KRAS WT, 4DSN for KRAS G12D, 1AO7 for HLA-A MHC-I) and computed per-residue solvent accessibility using the Shrake-Rupley algorithm via Biopython.
The key finding: G12 has a relative solvent accessibility (RSA) of 0.102, meaning it is partially buried at the GDP-binding interface in the P-loop (phosphate-binding loop). It does not meet the standard surface-exposure threshold of RSA >= 0.20.
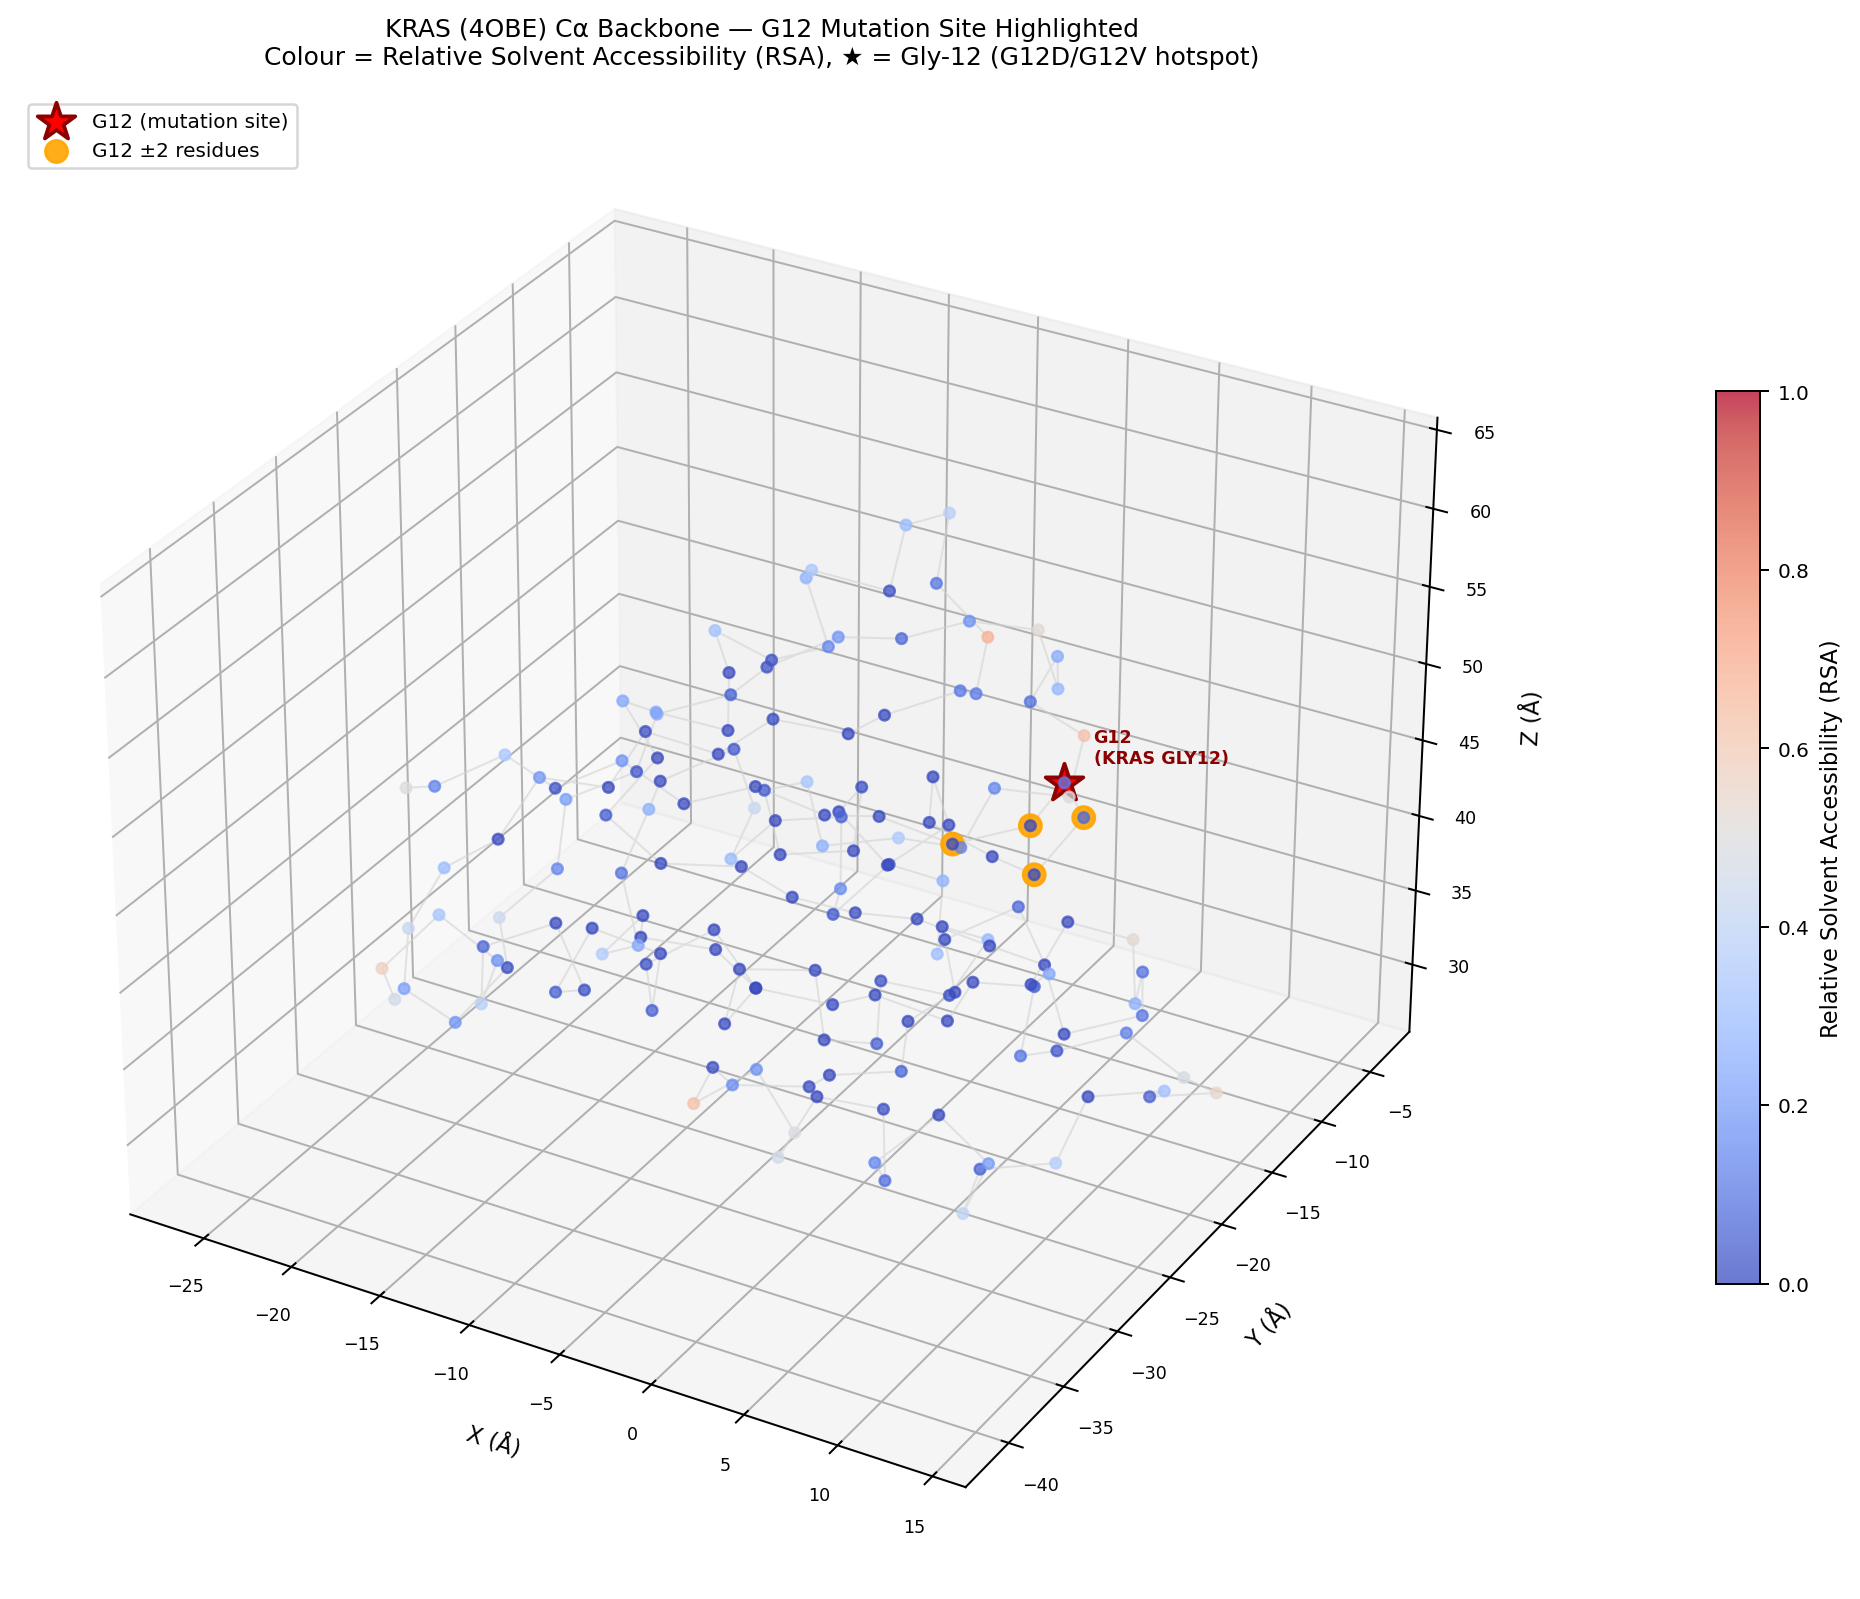
KRAS (PDB: 4OBE) backbone with residues colored by relative solvent accessibility. The G12 mutation site (red star) sits in the P-loop at the nucleotide-binding interface, with RSA = 0.102.
This has direct implications for vaccine design. Because G12 is partially buried in the native protein, the G12D/G12V neoepitopes (VVVGADGVGK and VVVGAVGVGK) must be proteolytically liberated by the 26S proteasome, transported to the ER via TAP, and loaded onto MHC-I for T cell recognition. These peptides are established neoepitopes presented by multiple HLA alleles (including HLA-A11:01, HLA-C08:02, and others) and have been validated in clinical adoptive T cell therapy and vaccine trials. The structural context explains why robust antigen processing machinery is a prerequisite for effective neoantigen presentation.
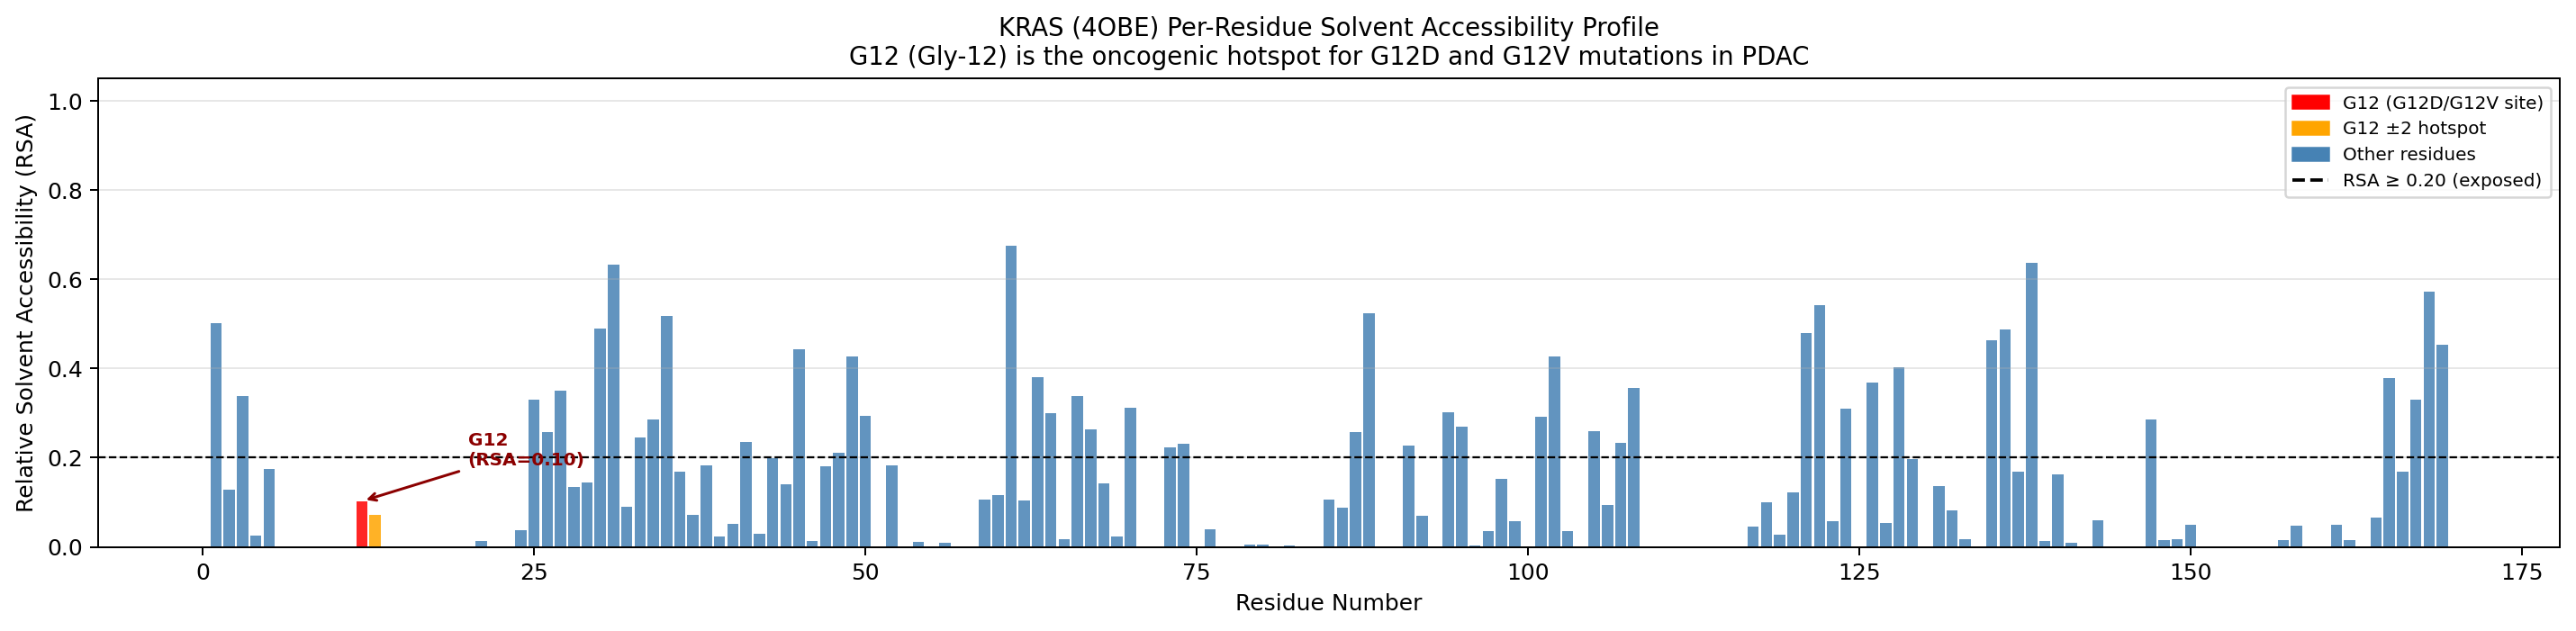
Per-residue RSA profile for KRAS. Only 27.2% of residues (46/169) meet the surface-exposure threshold (dashed line). G12 (red) falls below it, confirming its partially buried position.
The Neoantigen Funnel: 75 Mutations to 3 Candidates
How many actionable neoantigen candidates does a typical PDAC patient actually have? K-Dense Web modeled the complete filtering pipeline using median values from the TCGA PAAD cohort and published literature (Balachandran et al. 2017, Alexandrov et al. 2020):
| Stage | Candidates | Retention |
|---|---|---|
| Total Somatic Mutations | 75 | - |
| Nonsynonymous Coding | 52 | 69% |
| Expressed (RNA+) | 34 | 65% |
| MHC-I Binders (<500 nM) | 18 | 53% |
| MHC-II Binders (<1000 nM) | 12 | 67% |
| High-Confidence Neoantigens | 7 | 58% |
| Immunogenic Candidates | 3 | 43% |
Overall retention: approximately 4%. From 75 somatic mutations, only 3 reach the immunogenic candidate threshold. This is the fundamental constraint of neoantigen vaccine design in a low-TMB tumor: every candidate matters, and the selection algorithm must maximize sensitivity without sacrificing specificity.
The pipeline incorporates predictions from NetMHCpan 4.1 and pVACtools for MHC binding affinity, RNA expression filtering to ensure the mutant allele is actually transcribed, and multi-evidence immunogenicity scoring at the final stage.
The Tumor Microenvironment: Why Good Neoantigens Are Not Enough
Even a perfectly designed neoantigen vaccine will fail if vaccine-primed T cells cannot reach the tumor. PDAC's microenvironment is among the most immunosuppressive of any solid tumor, characterized by three overlapping barriers:
- TGF-beta-driven desmoplastic stroma: Cancer-associated fibroblasts (CAFs) deposit dense extracellular matrix that physically excludes T cells from tumor nests.
- CXCL12/CXCR4 chemokine axis: Stromal CXCL12 secretion actively routes immune cells away from the tumor.
- PD-1/PD-L1 and CTLA4 checkpoint suppression: Any T cells that do infiltrate are rapidly exhausted.
K-Dense Web queried the Open Targets Platform for PDAC-associated targets (MONDO_0005184), retrieved 5,000 gene-disease associations, and ranked 20 stromal immunosuppression targets by druggability:
| Rank | Gene | Pathway | OT Score | Druggability |
|---|---|---|---|---|
| 1 | TGFBR2 | TGF-beta Signaling | 0.372 | Medium |
| 2 | CD274 (PD-L1) | Immune Checkpoint | 0.361 | High |
| 3 | CXCR4 | CXCL12/CXCR4 Axis | 0.283 | High |
| 4 | STAT3 | IL-6/JAK-STAT | 0.281 | Medium |
| 5 | CTLA4 | Immune Checkpoint | 0.281 | High |
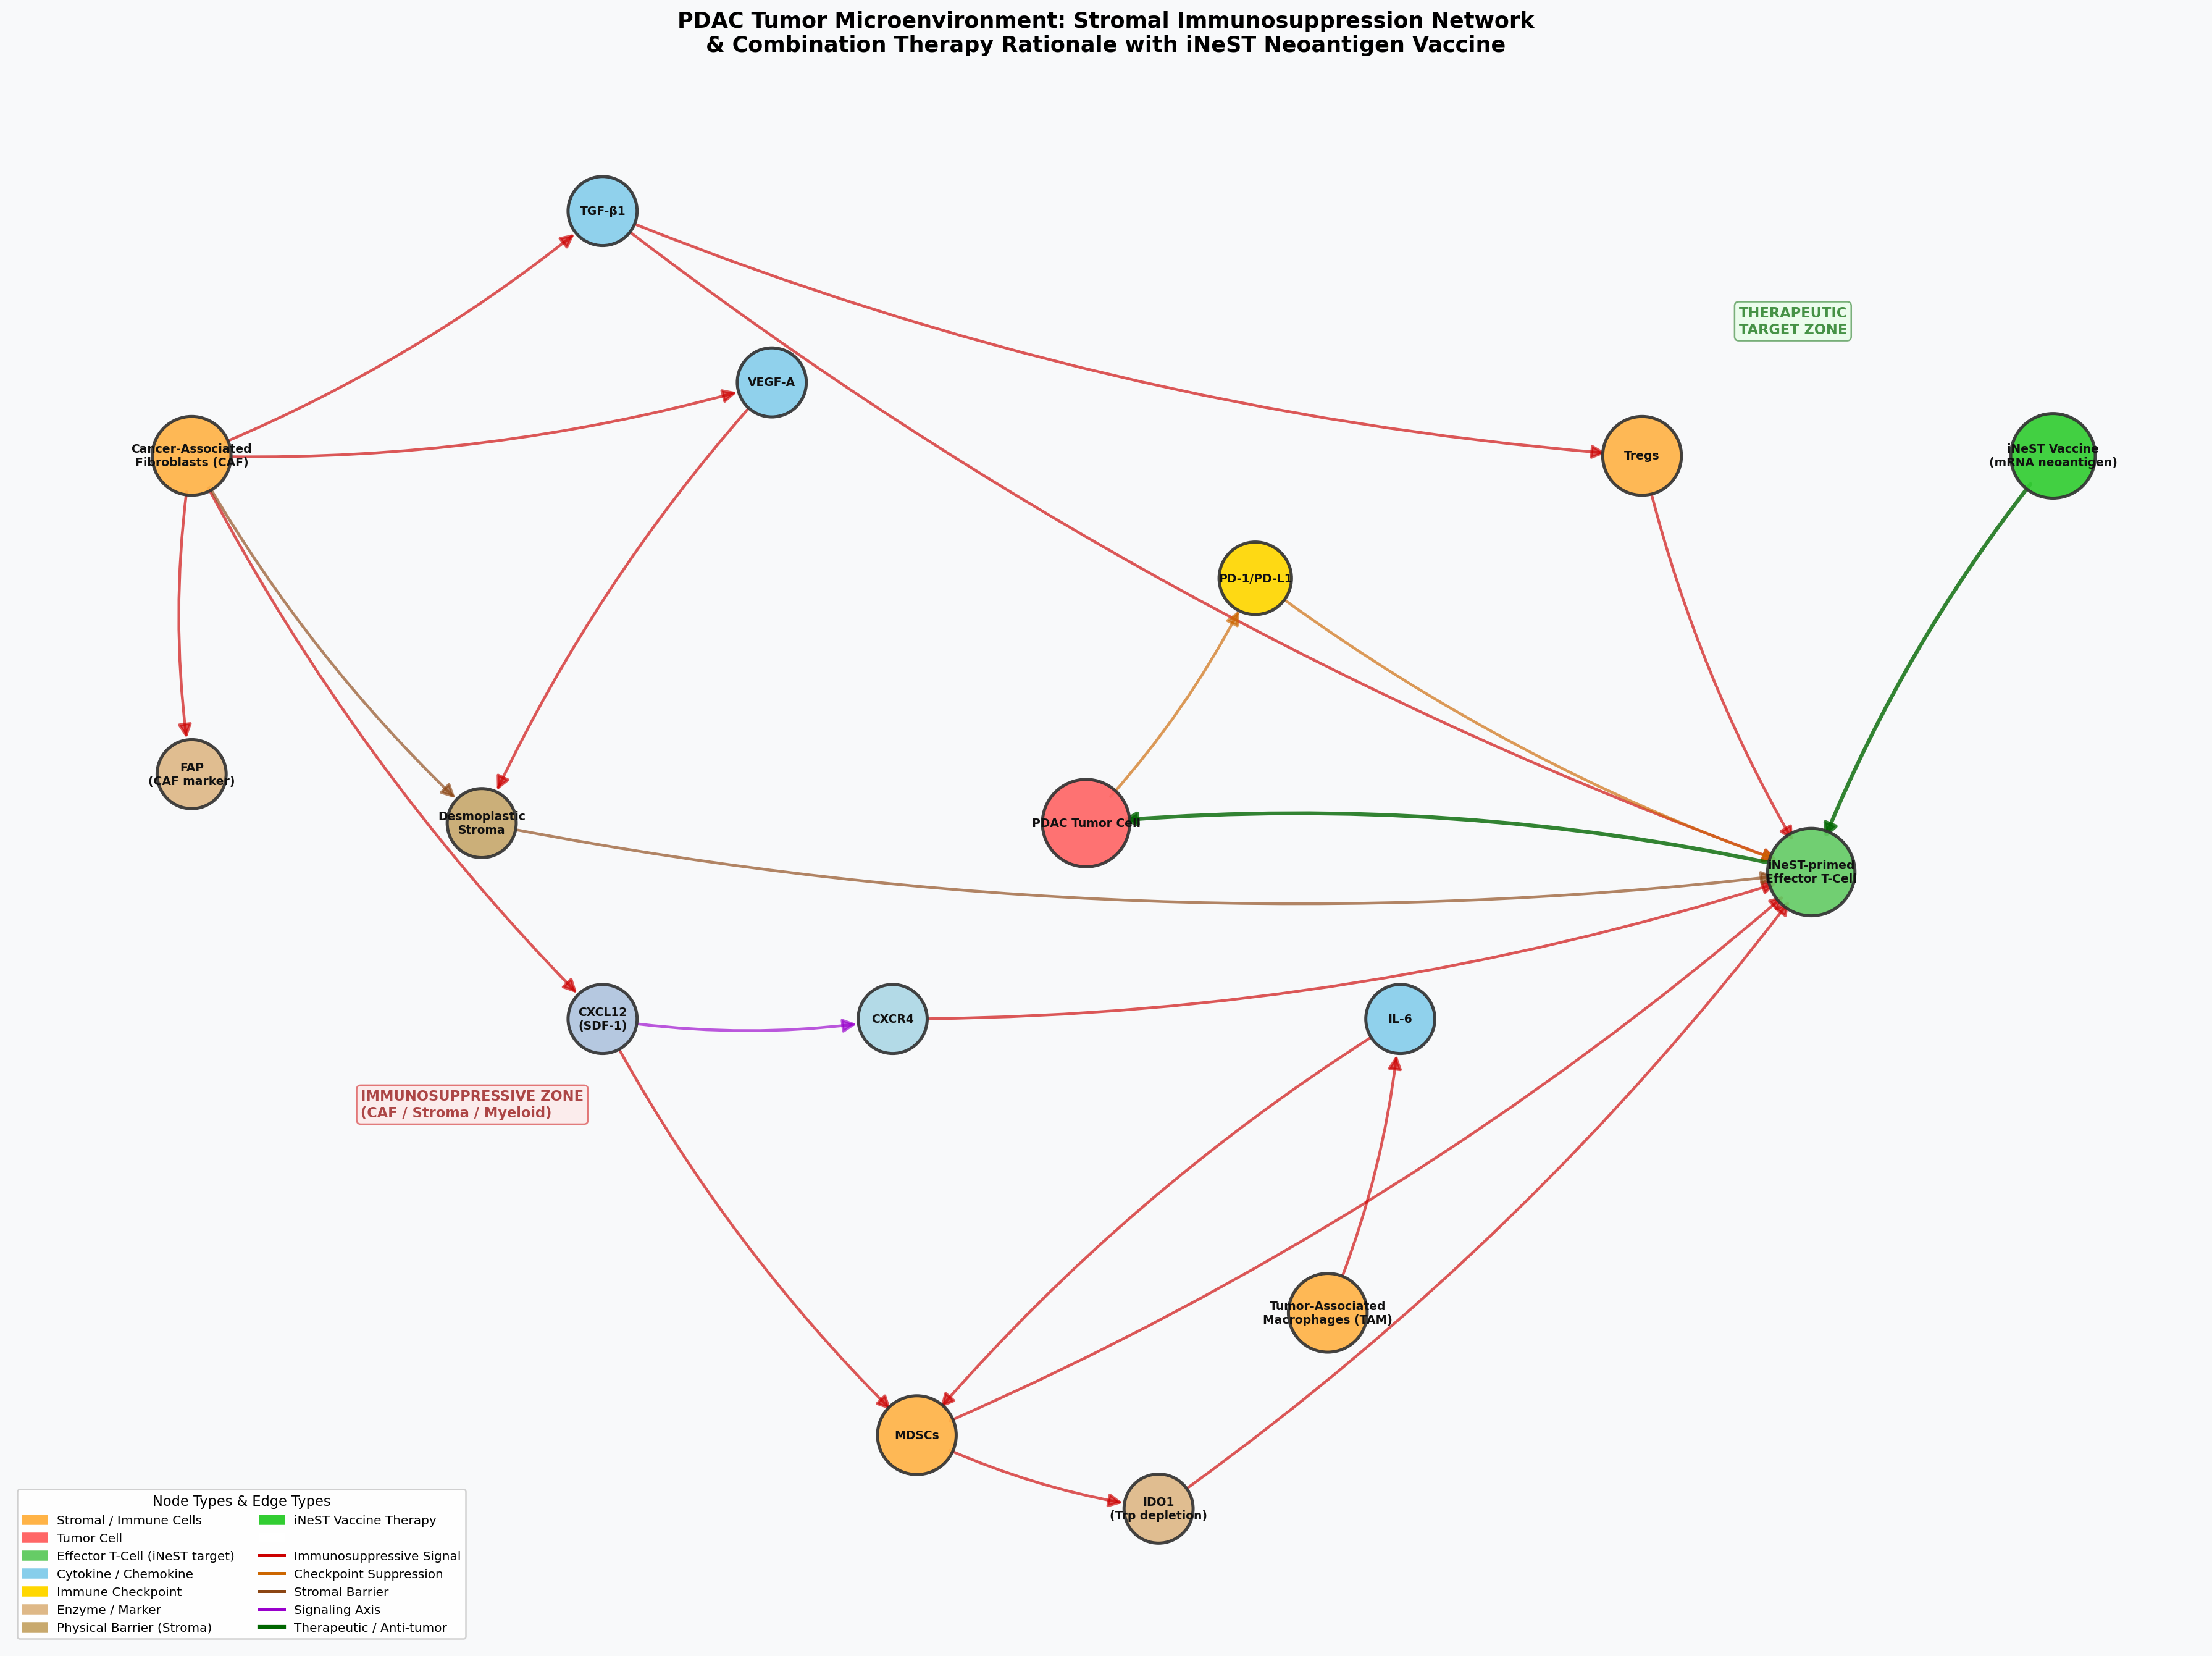
PDAC tumor microenvironment network. Red edges represent immunosuppressive signaling; green edges represent therapeutic interventions. The iNeST vaccine generates neoantigen-specific T cells (right), but TGF-beta, CXCL12/CXCR4, and PD-1/PD-L1 axes must be co-targeted for those T cells to reach the tumor.
This analysis provides the biological rationale for combination therapy: iNeST vaccines paired with checkpoint inhibitors and, potentially, TGF-beta or CXCR4 pathway modulators to dismantle the stromal barrier.
Clinical Trial Landscape and Literature Synthesis
K-Dense Web queried ClinicalTrials.gov for active PDAC neoantigen vaccine trials and synthesized 67 PubMed articles (2021-2026) across four topic areas.
| NCT ID | Phase | Status | Sponsor | N | Primary Endpoint |
|---|---|---|---|---|---|
| NCT05968326 | Phase 2 | Recruiting | Genentech | 260 | Disease-Free Survival |
| NCT04161755 | Phase 1 | Active, not recruiting | Memorial Sloan Kettering | 29 | Safety |
| NCT03953235 | Phase 1/2 | Completed | Gritstone Bio | 39 | AEs, SAEs |
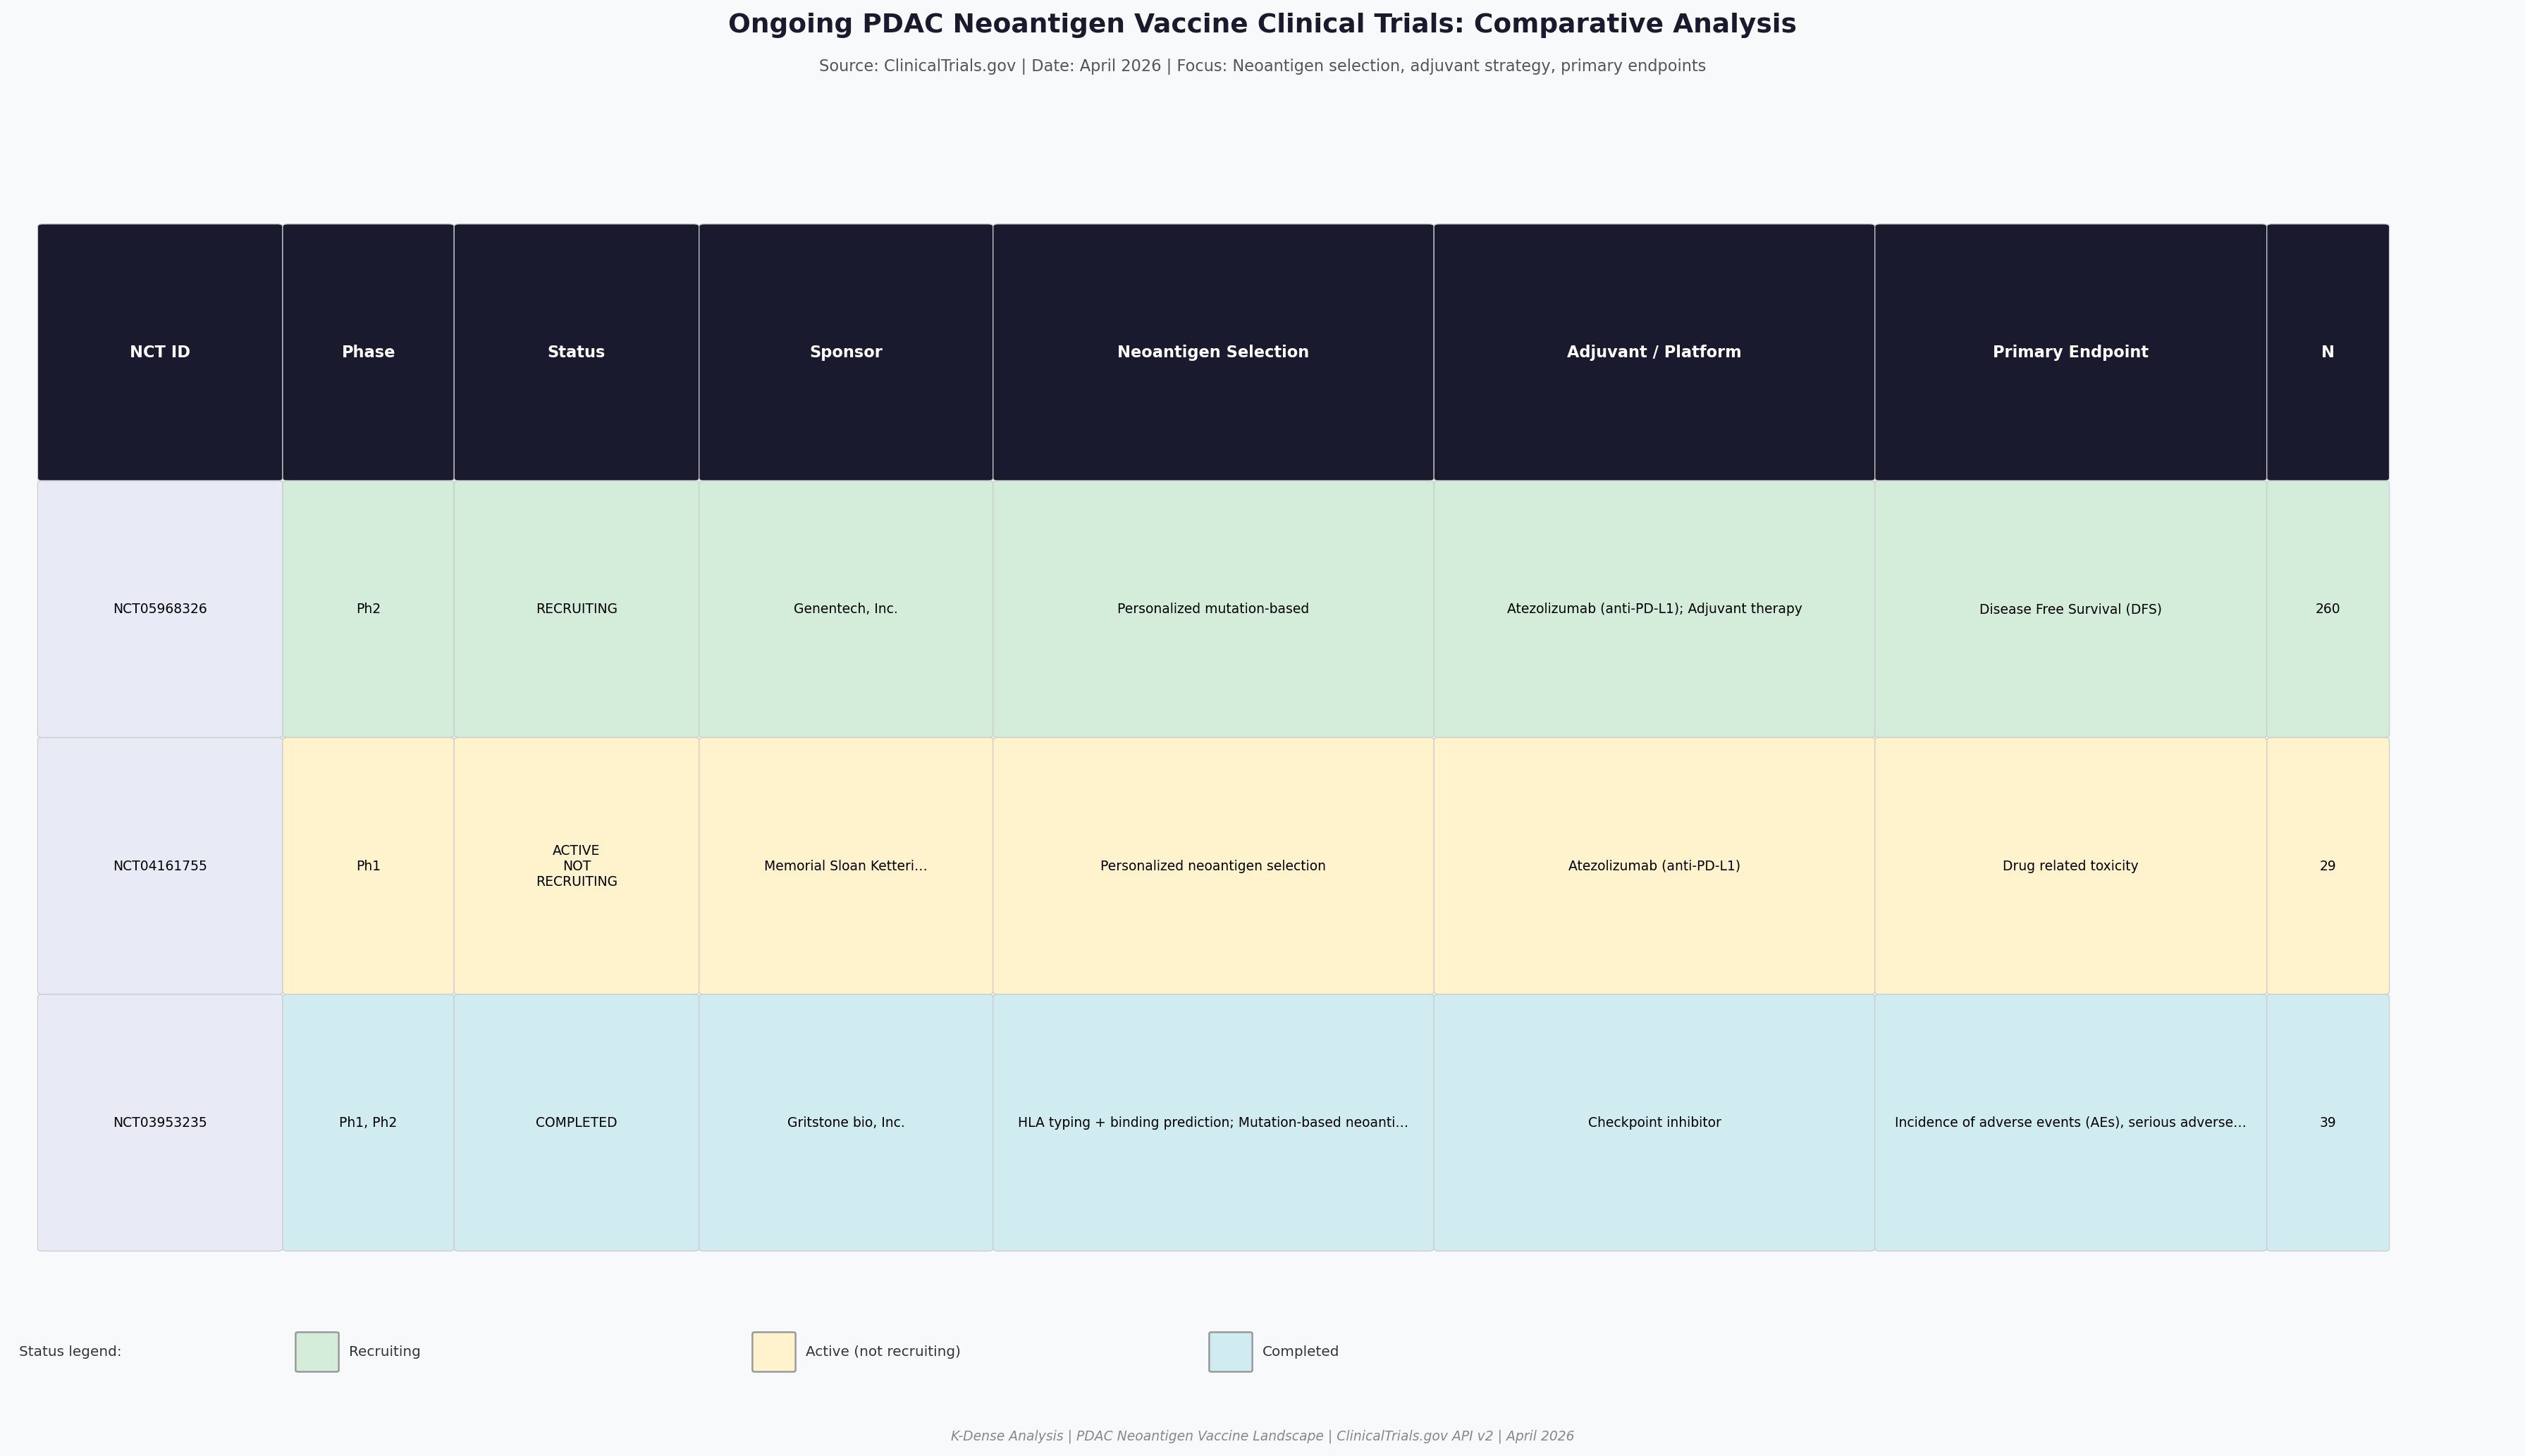
Comparative analysis of PDAC neoantigen vaccine trials. IMCODE003 (NCT05968326) is the largest and most advanced, testing autogene cevumeran + atezolizumab + mFFX vs. mFFX alone in resected PDAC.
The literature synthesis captured the rapidly growing evidence base across neoantigen prediction algorithms, mRNA vaccine immune correlates, PDAC stroma biology, and KRAS-targeted vaccines. Publication volume has accelerated sharply, with 2023-2025 accounting for the majority of recent work.
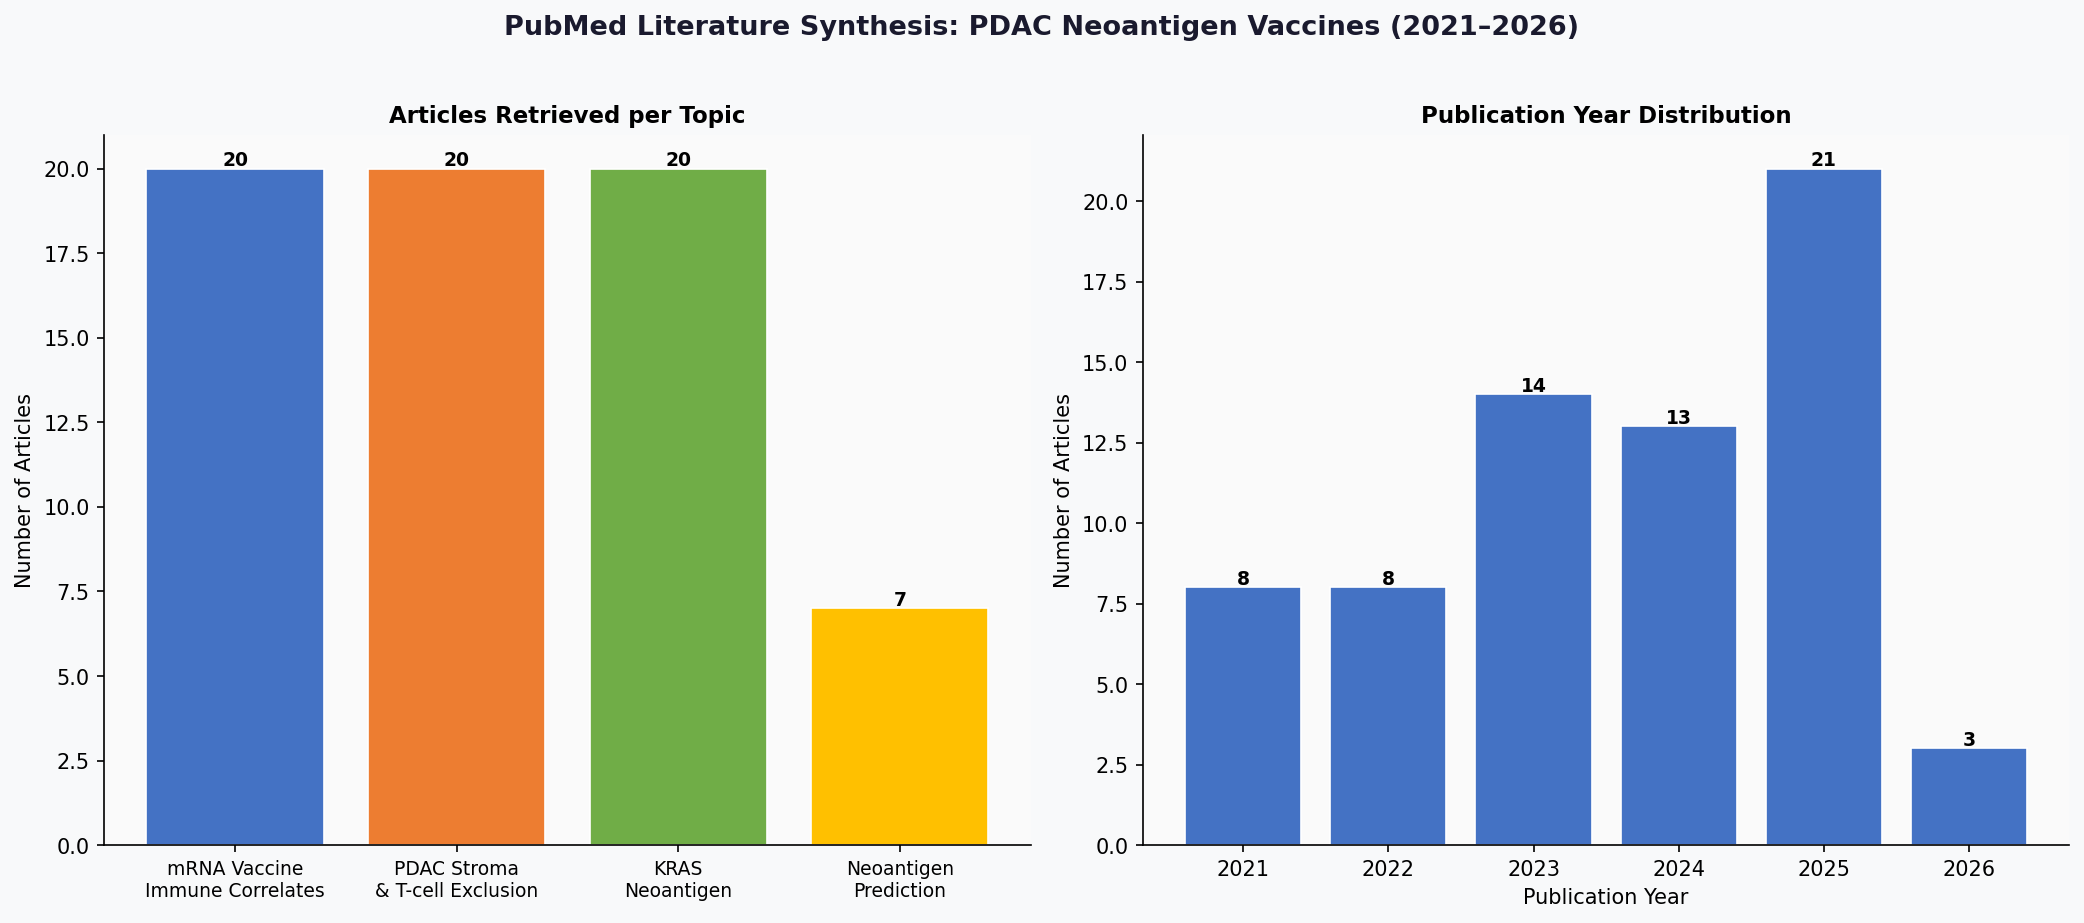
Literature synthesis: 67 articles across 4 topics, with publication volume peaking in 2025. The field is rapidly generating new evidence on neoantigen prediction, vaccine correlates, and stromal biology.
What This Pipeline Replaced
Building a PDAC neoantigen landscape analysis of this scope traditionally requires a cross-functional team of bioinformaticians, structural biologists, clinical scientists, and translational oncologists working across weeks or months. The data acquisition alone (querying 6 different APIs, downloading PDB structures, parsing clinical trial records, retrieving thousands of PubMed abstracts) typically takes days of scripting and debugging.
K-Dense Web ran the full pipeline in a single session. It designed the analysis strategy, wrote 6 Python scripts, applied appropriate statistical methods (Kruskal-Wallis, Mann-Whitney U with Bonferroni correction, Shrake-Rupley SASA), generated 9 publication-quality figures, and produced a 36-slide presentation with tiered neoantigen selection recommendations and combination therapy strategies.
The output is a complete translational oncology dossier: from raw genomic data to clinical trial design rationale, ready for review by a vaccine development team.
Get the Full Analysis
The complete 36-slide presentation includes all figures, detailed methods, tiered neoantigen selection criteria, mutation prioritization recommendations, and combination therapy strategies.
Download the Full PDF Presentation
Questions? Contact us at contact@k-dense.ai