Due diligence is mostly a time problem. The research, the modeling, the memo-writing - none of it is intellectually impossible. It's just a lot of it, done in a hurry, with analysts juggling multiple deals at once.
K-Dense Web compresses that timeline. In this post, I'll walk through two analyses the platform ran end-to-end: CoreWeave ($19B+ GPU infrastructure) and Ramp ($32B fintech). Both went from a single prompt to an IC-ready memo in under two hours.
The due diligence problem
Investment committees want answers to the same questions on every deal: How big is the market? Do the unit economics work? What's the moat? What could go wrong?
Getting those answers traditionally means analysts manually pulling data from dozens of sources, building models from scratch, writing competitive analyses, drafting memos, and designing IC decks. K-Dense Web runs that whole sequence autonomously.
Case study 1: CoreWeave
Company: CoreWeave, Inc.
Sector: GPU-as-a-Service / AI Infrastructure
Valuation: $19B+ (January 2026)
The prompt
"Conduct comprehensive VC due diligence on CoreWeave. Include market sizing, unit economics modeling, competitive analysis, and risk assessment. Generate an investment memo with recommendation."
What came back
K-Dense Web ran a four-step workflow:
- Market sizing and competitive analysis: TAM/SAM/SOM projections (2024-2030), pricing comparison across 7 providers
- Unit economics: Per-GPU financial model with 88 utilization scenarios
- Risk analysis: Quantitative risk matrix, customer concentration, Porter's Five Forces
- Reporting: Executive dashboard, investment memo, recommendation
Total time: under 2 hours.
The investment thesis
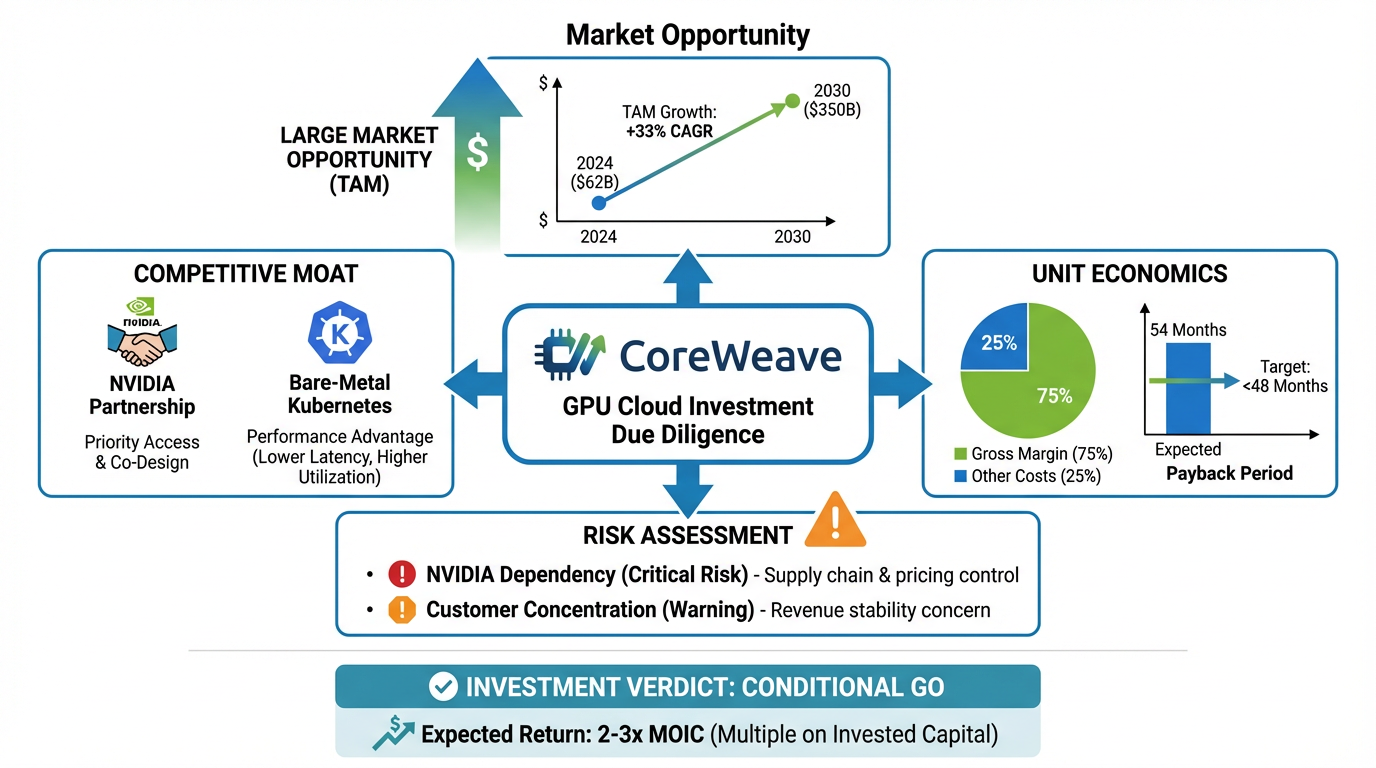 Figure 1: CoreWeave investment thesis overview generated by K-Dense Web
The platform landed on a CONDITIONAL GO:
| Metric | Value | Assessment |
|---|---|---|
| TAM CAGR (2024-2030) | 33.4% | Strong market tailwind |
| Gross Margin | 74-80% | Excellent unit economics |
| Cash Payback | 42-59 months | Within asset life |
| Critical Risks | 1 (NVIDIA dependency) | Requires mitigation |
| Expected Return | 2-3x (probability-weighted) | Attractive |
Market sizing
The model projected AI infrastructure growing from $62B (2024) to $350B by 2030:
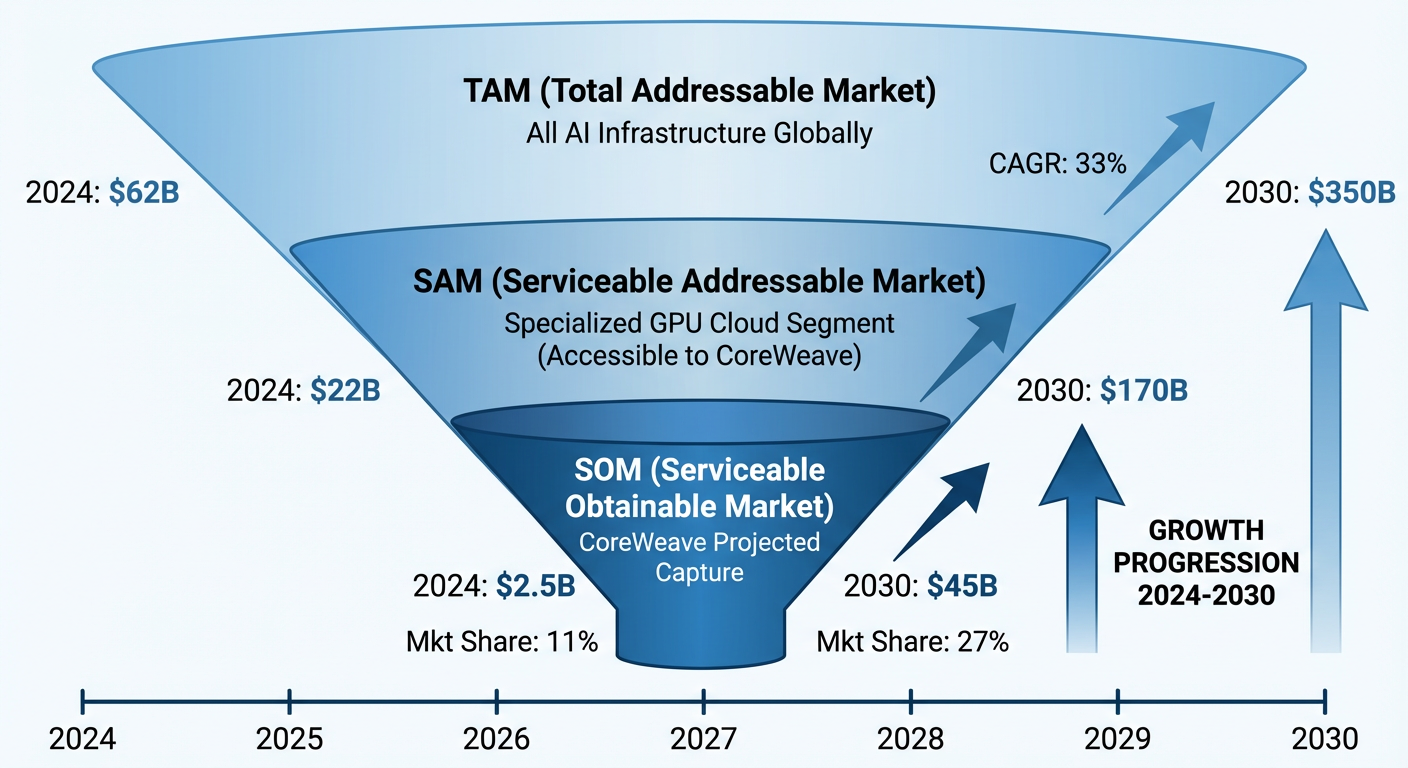 Figure 2: TAM/SAM/SOM market sizing funnel with 6-year projections
Competitive positioning
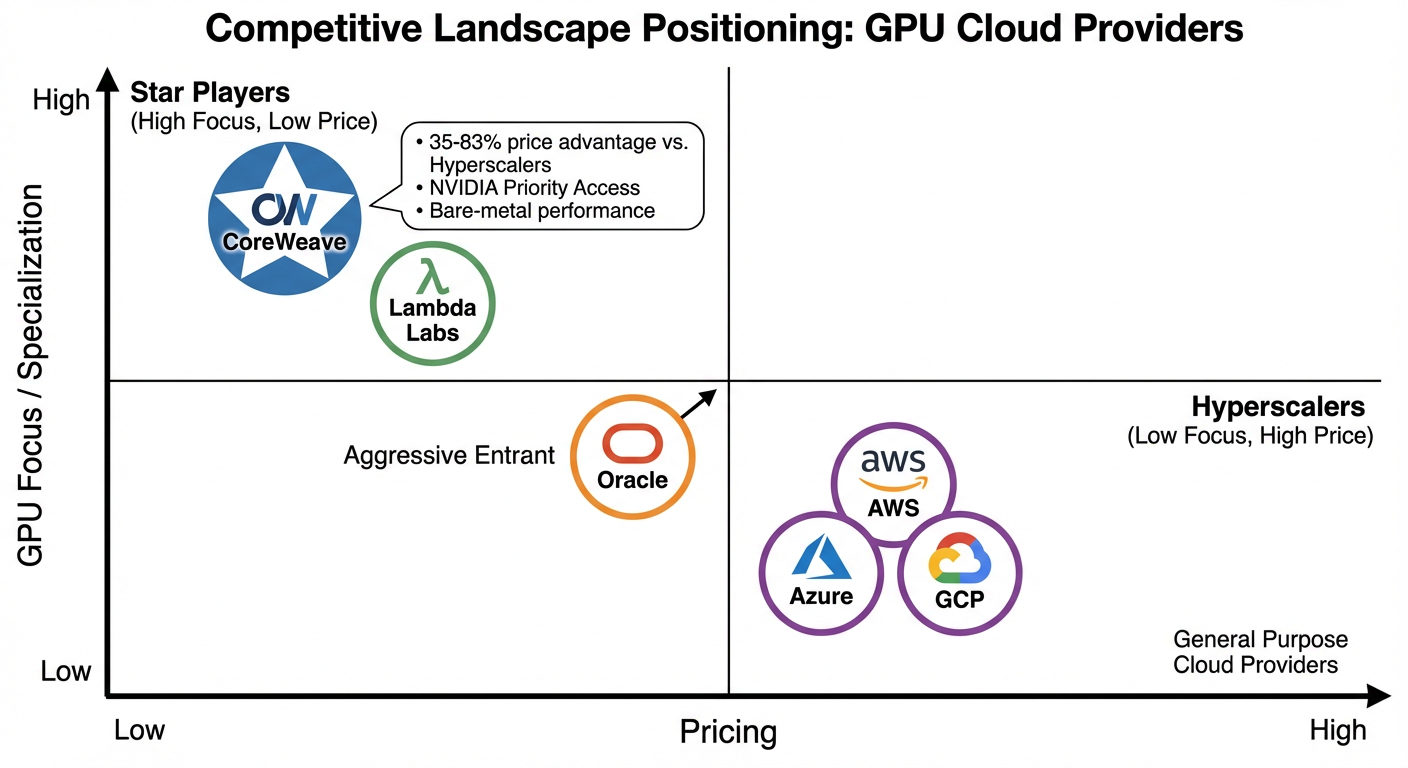 Figure 3: CoreWeave vs. hyperscalers and specialists
CoreWeave runs 35-83% below AWS, Azure, and GCP on pricing. That's the moat - at least for now.
Unit economics
The model ran 88 scenarios across utilization levels:
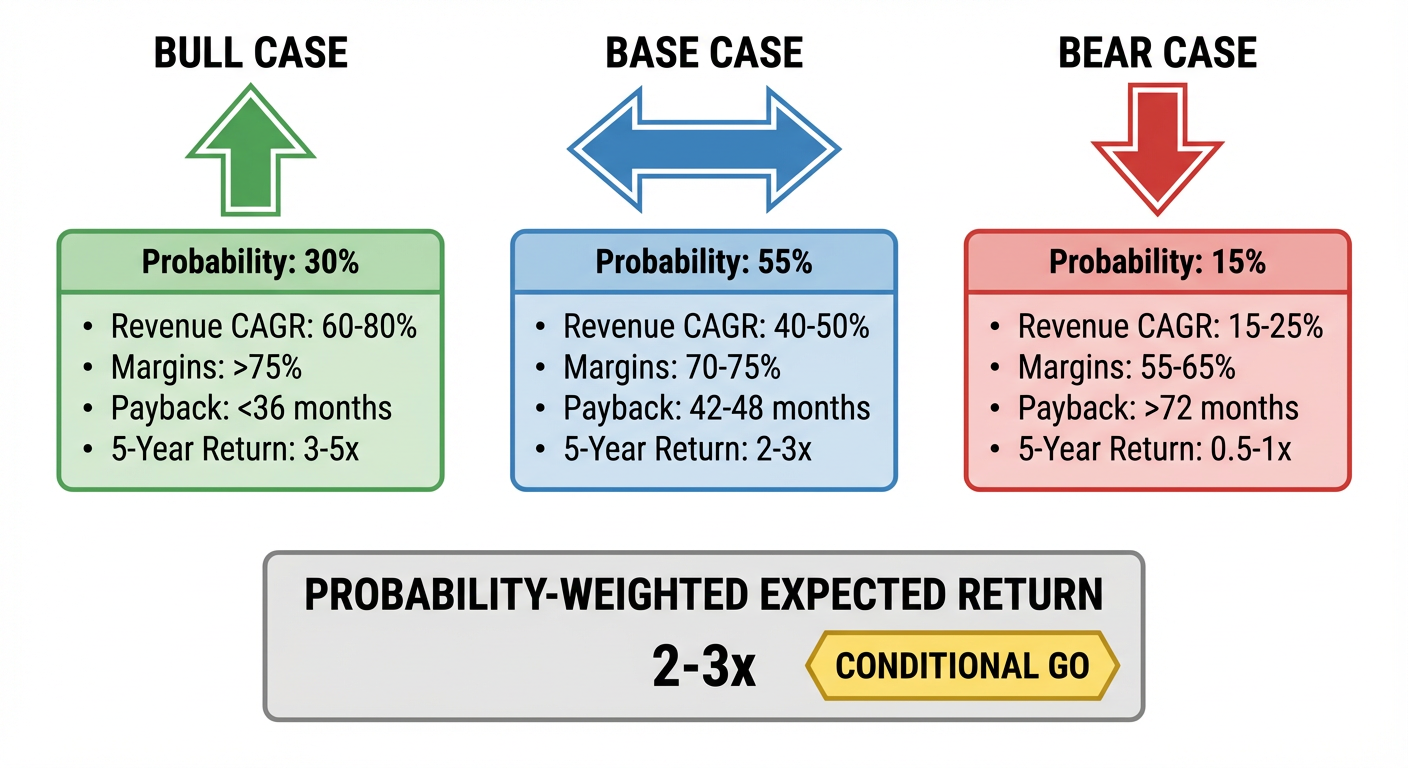 Figure 4: Probability-weighted investment scenarios (Bull/Base/Bear)
| Utilization | Gross Margin | Cash Payback |
|---|---|---|
| 65% | 74.9% | 59.2 months |
| 70% | 76.4% | 53.9 months |
| 85% | 79.7% | 42.6 months |
Risk assessment
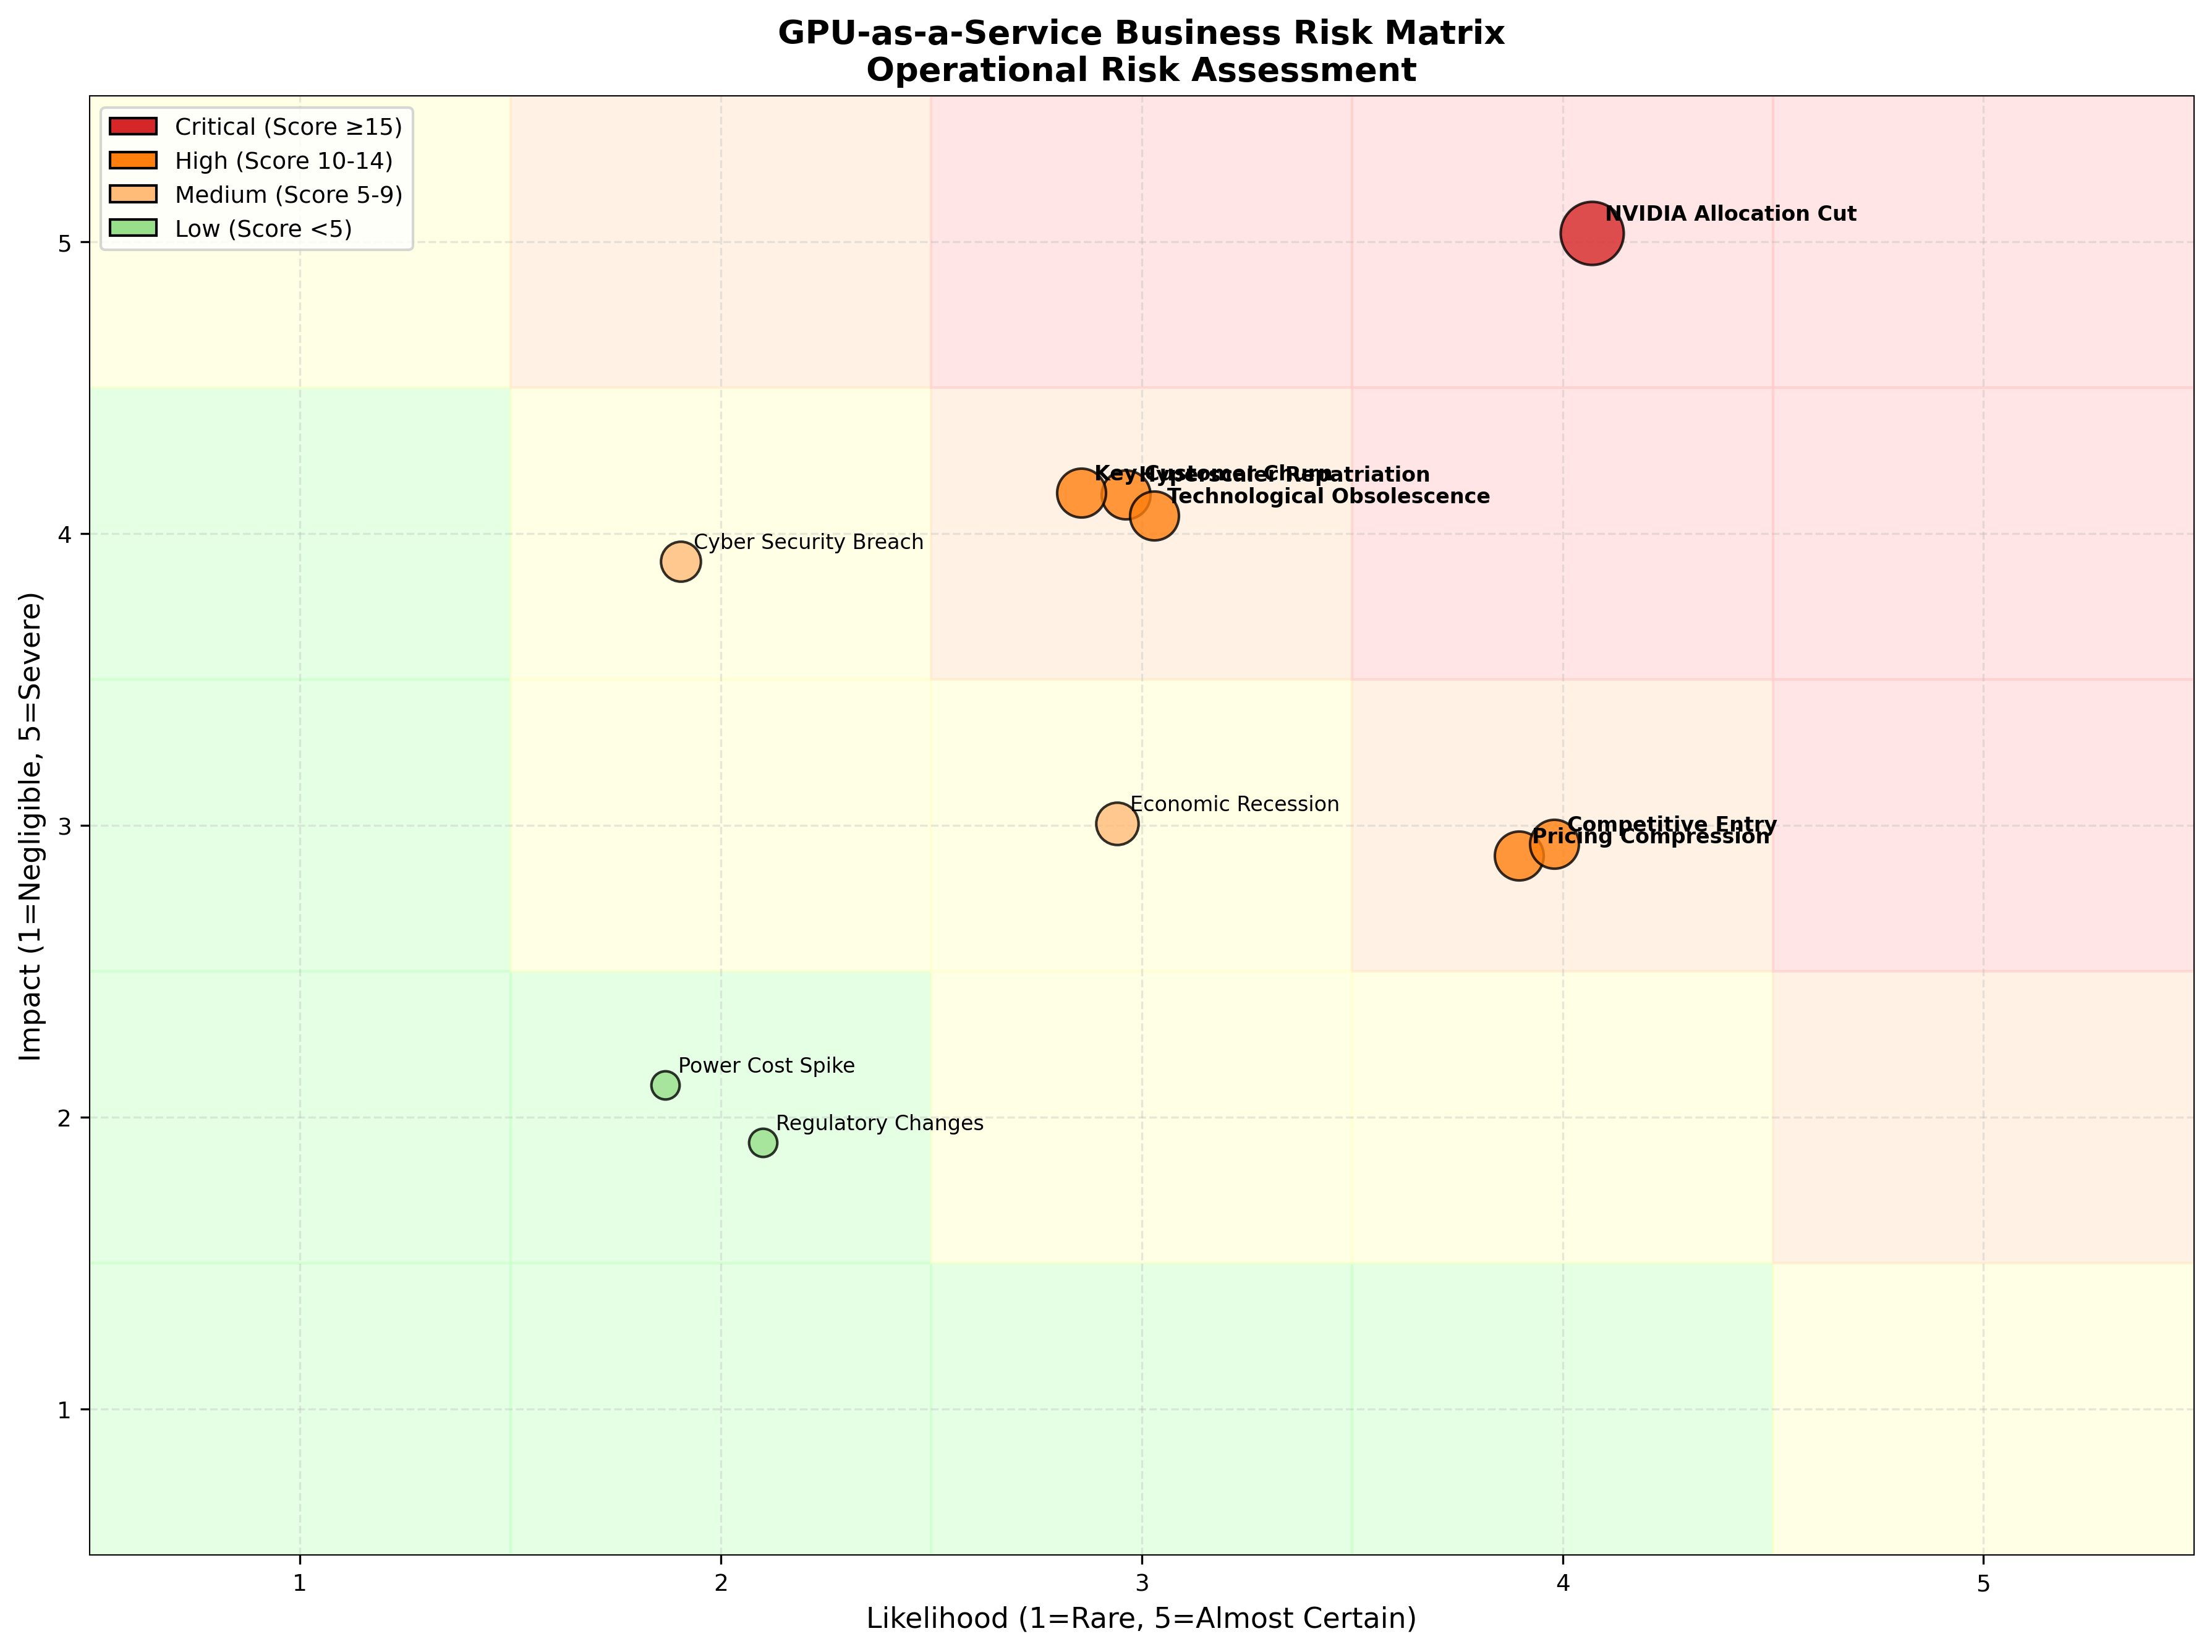 Figure 5: Quantitative risk matrix with 10 identified risks
NVIDIA dependency scored 20/25 as the single critical risk. CoreWeave's entire business sits on NVIDIA's allocation decisions. That's the thing worth losing sleep over.
Executive dashboard
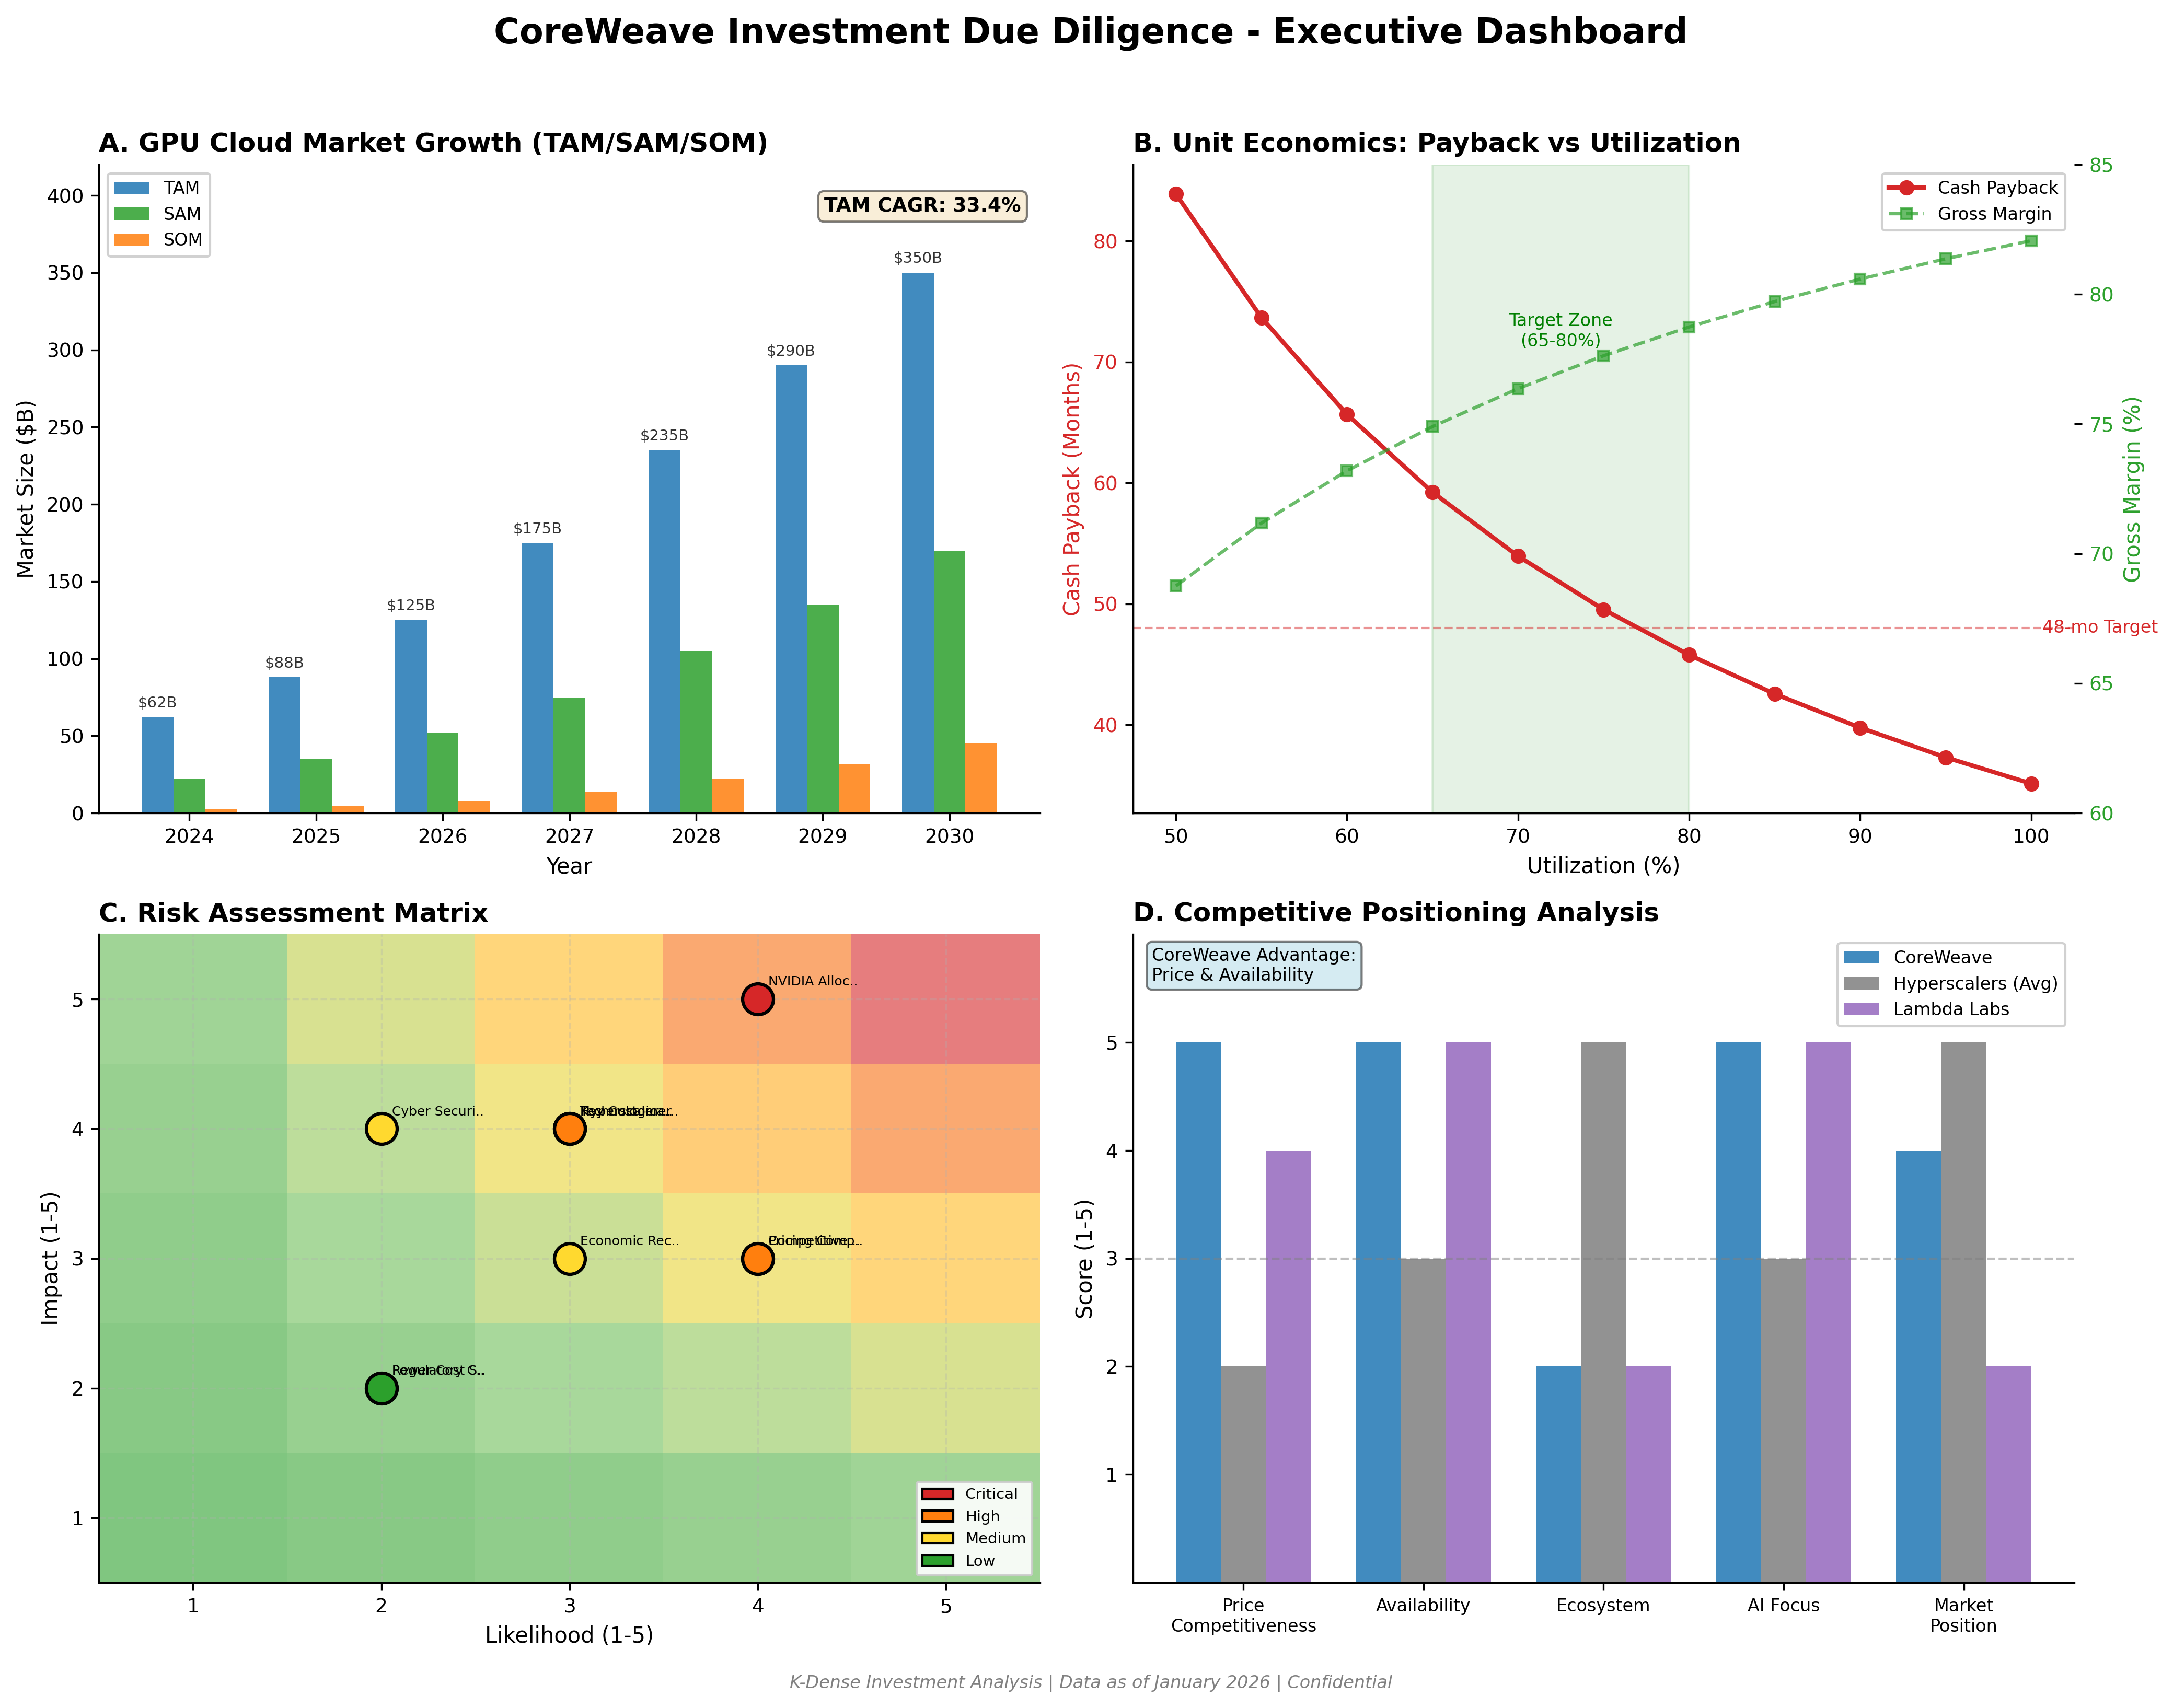 Figure 6: Four-panel executive dashboard for IC presentation
Download the full report
Download CoreWeave Due Diligence Report (PDF)
Case study 2: Ramp
Company: Ramp Technologies, Inc.
Sector: Corporate Card & Spend Management
Valuation: $32B (November 2025)
The prompt
"Conduct comprehensive VC due diligence on Ramp. Analyze market sizing, competitive positioning, unit economics, and risks. Generate an investment memo with valuation scenarios."
What came back
A 44-page investment analysis with:
- Executive summary and recommendation
- TAM/SAM/SOM analysis ($50B+ market)
- Competitive benchmarking against Brex, Bill.com, Airbase
- Unit economics breakdown (interchange, SaaS, float revenue)
- IPO readiness scorecard
Total time: under 2 hours.
The investment thesis
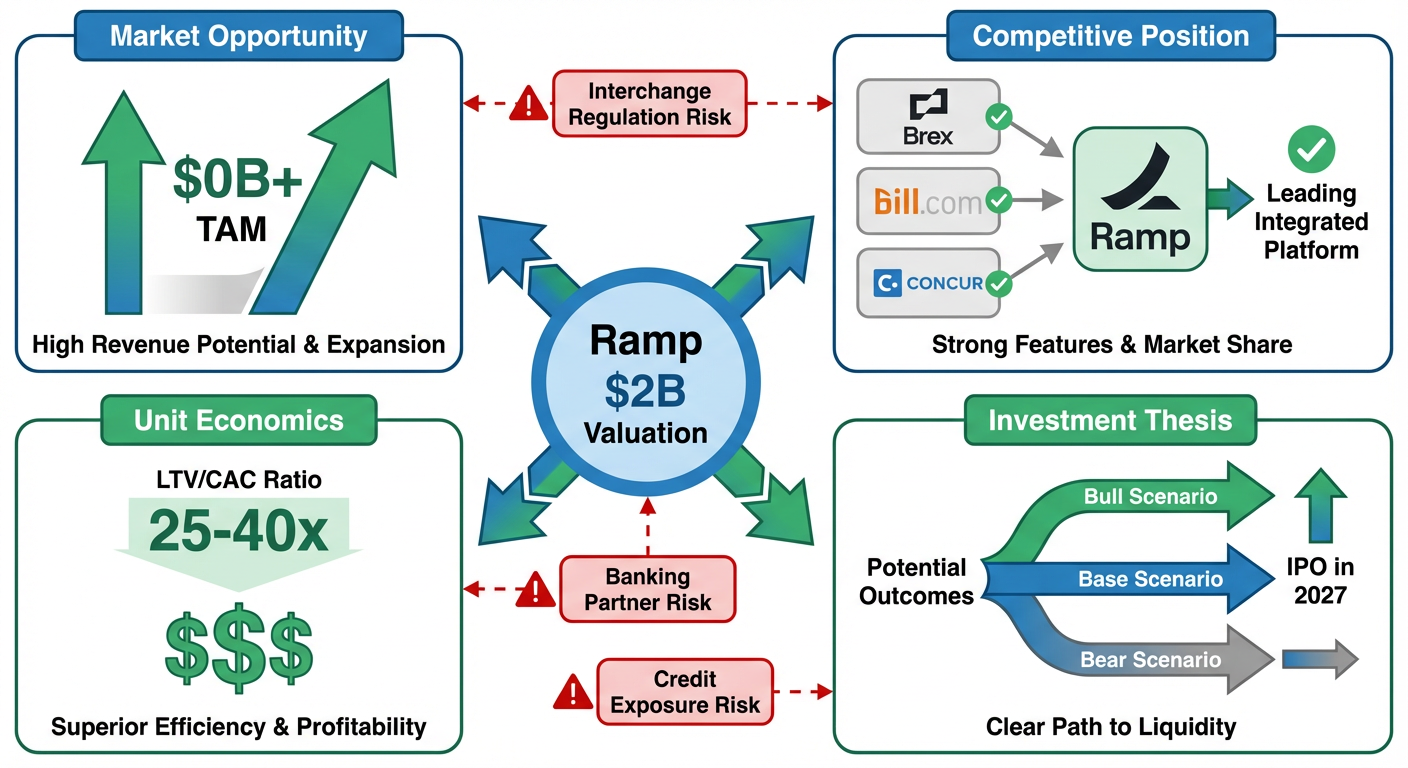 Figure 7: Ramp investment thesis - AI-first spend management platform
K-Dense Web came back with a STRONG BUY:
| Metric | Value |
|---|---|
| Revenue | >$1B annualized |
| Growth Rate | 110-133% YoY |
| Total Payments Volume | >$100B annually |
| Customers | 50,000+ (doubled YoY) |
| LTV/CAC Ratio | 25-40x |
| IPO Readiness | 8.3/10 |
Market sizing
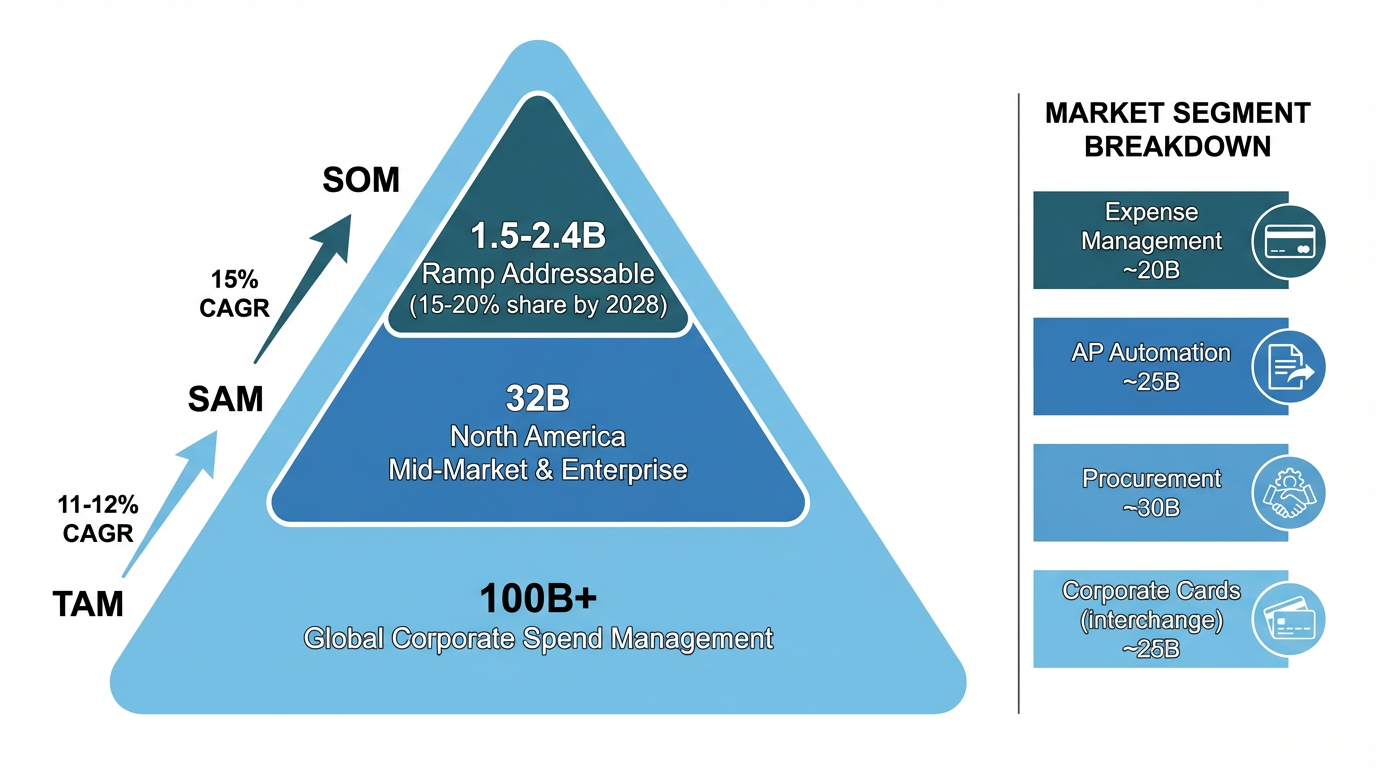 Figure 8: $50B+ market opportunity with segment breakdown
Competitive positioning
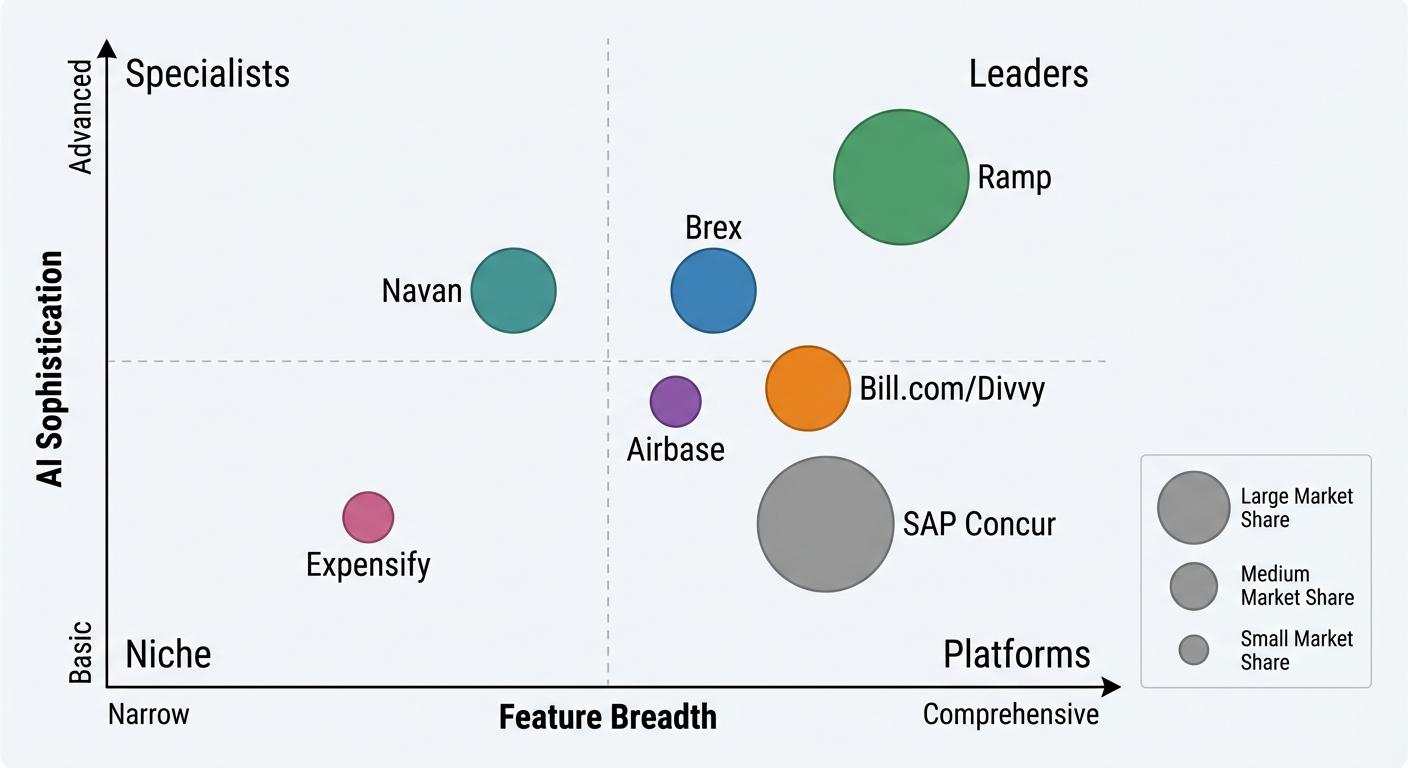 Figure 9: Competitive positioning - Ramp leads in AI sophistication
Unit economics
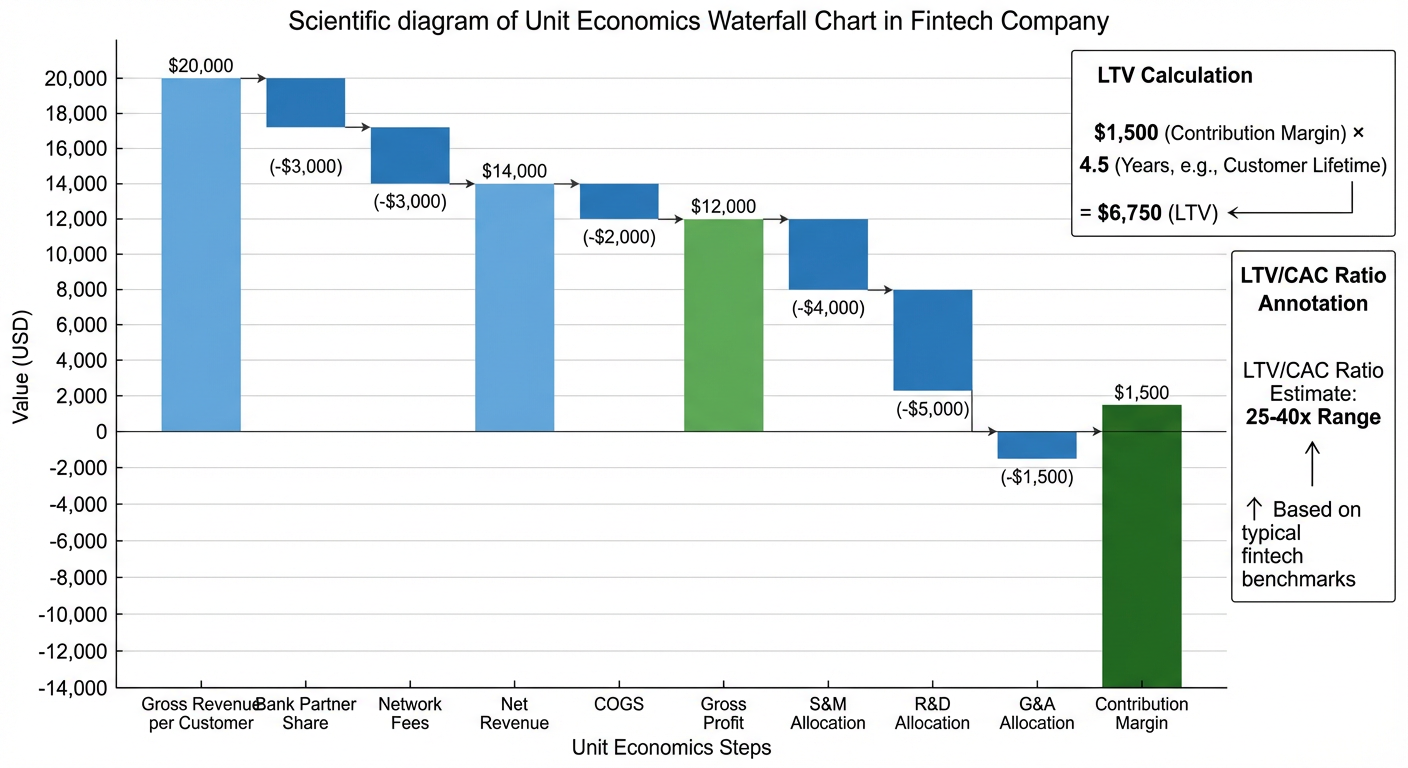 Figure 10: Customer LTV build-up
A 25-40x LTV/CAC ratio puts Ramp among the better enterprise SaaS businesses I've seen modeled. The numbers hold up.
Growth trajectory
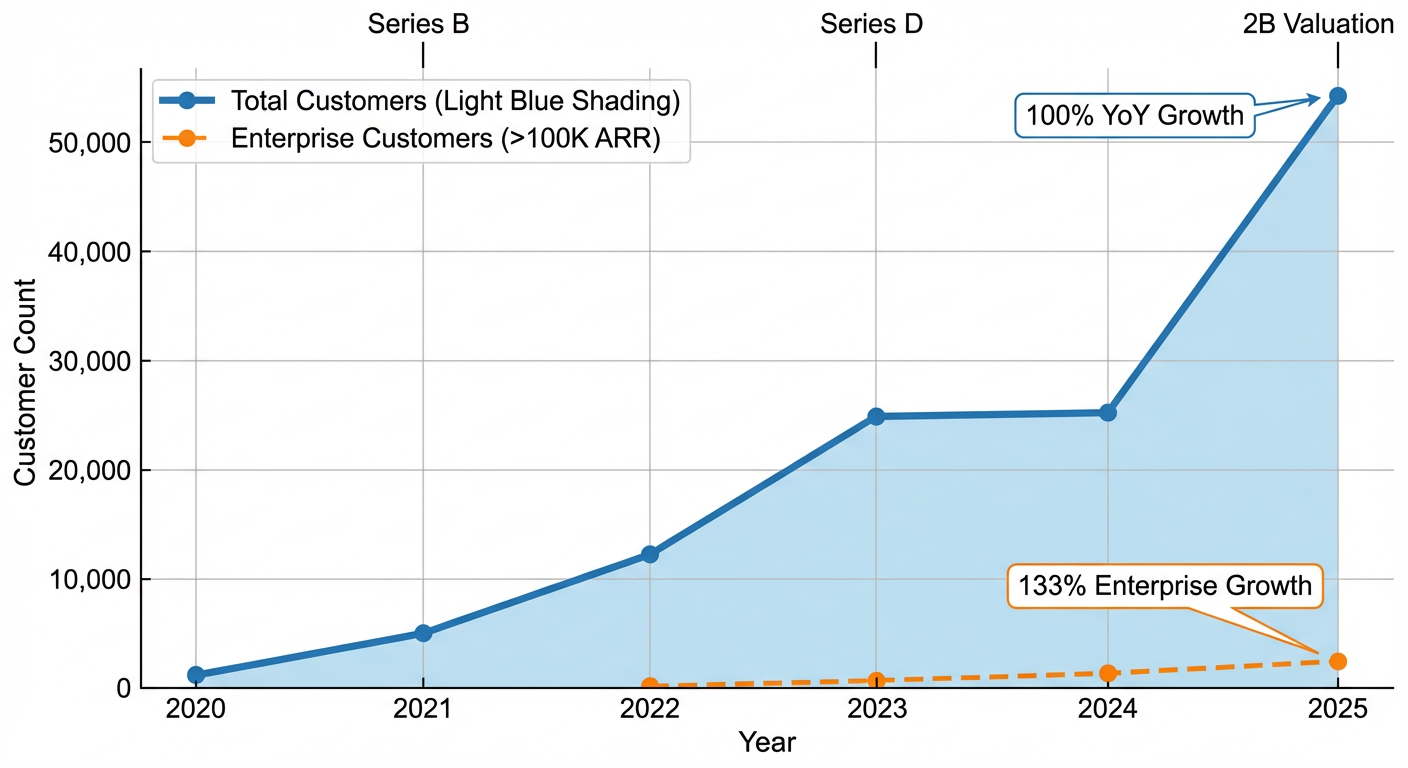 Figure 11: Ramp customer growth showing enterprise acceleration
Valuation scenarios
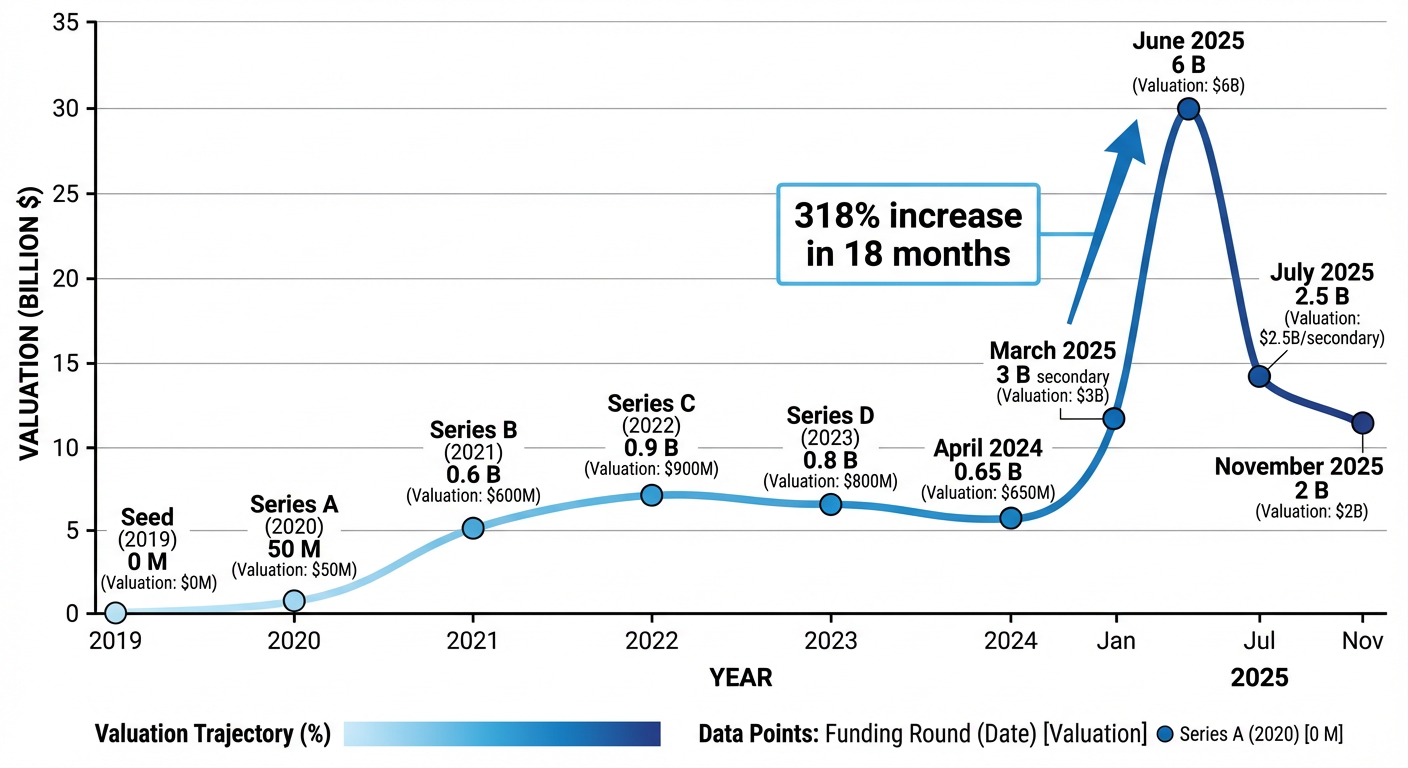 Figure 12: Funding and valuation milestones with forward projections
| Scenario | Valuation (2027-28) | Probability |
|---|---|---|
| Bull | $50-60B | 30% |
| Base | $28-35B | 50% |
| Bear | $12-18B | 20% |
Risk assessment
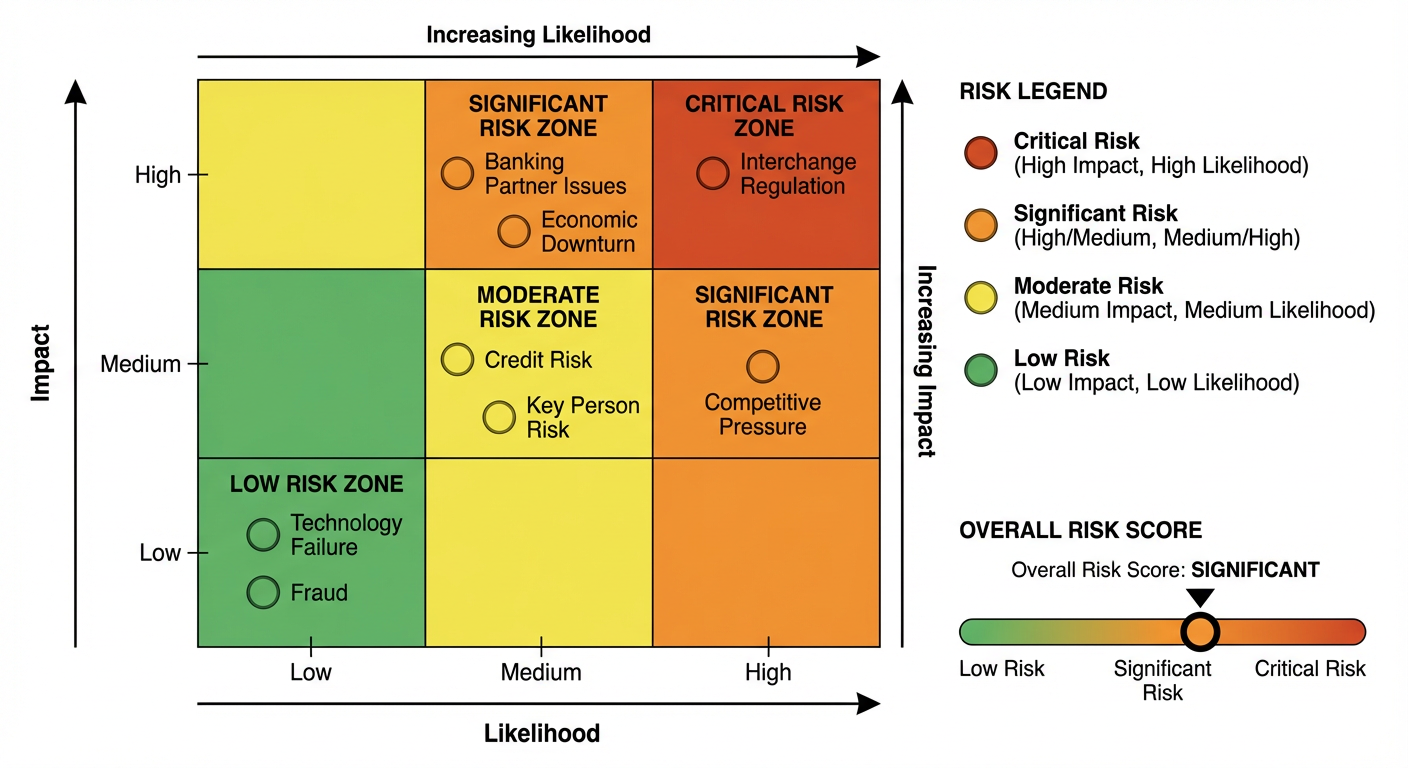 Figure 13: Ramp risk matrix
Interchange fee regulation is the primary risk - it could compress margins 30-40%. Worth modeling explicitly in any serious analysis.
Download the full report
Download Ramp Due Diligence Report (PDF)
What the platform actually does
Running two analyses back-to-back, the pattern is consistent: market research, financial modeling, competitive analysis, risk matrix, final memo. Same playbook every time, which is partly the point. Every output includes the underlying scripts, data sources, and methodology - nothing is a black box.
The practical difference from manual analysis isn't just speed. You can run this on ten deals in the time it used to take to do one. Most firms would use that to look at more deals. Some might go deeper on fewer. Either way, analyst hours shift toward judgment calls and relationship work - the stuff that actually requires a human - and away from data aggregation.
Get started
Sign up and run a full analysis on your next deal.
Questions? Reach out at contact@k-dense.ai.