A polished answer is not yet a research result. Scientists also need to know which data were used, which code produced each number, whether the environment can be recreated, where uncertainty entered the workflow, and what another researcher can inspect after the chat is over.
That distinction decided our 20-task comparison of K-Dense Web and Claude Science. The result was not an across-the-board victory for either platform, which makes the outcome more useful than a simple model ranking.
K-Dense Web achieved the higher mean composite score, 67.8 versus 61.8, and led 14 of 20 prompts. Its decisive advantage was research execution: 14.7/25 versus 6.4/25, with K-Dense ahead on all 20 tasks. Claude Science, however, earned the higher mean scientific-quality score, 55.3/75 versus 53.1/75.
The practical conclusion is narrower than “K-Dense is smarter.” In this benchmark, K-Dense Web was better at turning analysis into an auditable, reusable research product. Claude Science sometimes did the better scientific analysis, including the highest-scoring result in the entire comparison. The cover summarizes the mean scores and prompt-level results; the composite combines scientific quality and research execution, so it should not be interpreted without both components.
Disclosure: This benchmark and article were produced by K-Dense, one of the two evaluated platforms. Platform identity was visible to the evaluator through the submitted artifacts. To make that conflict inspectable, this article reports Claude Science’s wins, the uncertainty around the composite result, the full limitations, and the benchmark materials alongside the K-Dense findings.
What we tested
The 20 equally weighted questions in this comparison are interdisciplinary in nature and form part of a broader 120-question benchmark at K-Dense. They span biomedical, ecological, geospatial, environmental, and engineering research, while the remaining questions are domain-focused. We are working to publish the broader benchmark results soon.
The exact benchmark prompts
P1 → Oncology and Medicinal Chemistry
Using the open masked-mutation and RNA-expression data for GDC project TCGA-LUAD from Data Release 45.0, ChEMBL 37 assays for EGFR (CHEMBL203), and the osimertinib-bound EGFR structure PDB 4ZAU, identify one inhibitor chemotype and a 4–6-mutation biochemical panel for a preclinical resistance study. Separate biochemical from cellular assays, normalize comparable potency measurements, cluster compounds by scaffold, and integrate assay quality with tumor variant prevalence and expression. Deliver a ranked chemotype–mutation matrix, the nominated series and mutation panel, a structural rationale, and explicit go/no-go uncertainties; do not make patient-treatment recommendations.
P2 → Infectious-Disease Genomics and Structural Biology
Using the corrected WHO 2023 Mycobacterium tuberculosis mutation catalog (ISBN 9789240082410, files pinned at commit 0bb3914348c5a4c981859601447834c08f03ee3d) and the rifampicin-bound RNA-polymerase structure PDB 5UHB, select 8–12 rpoB substitutions for a surveillance and laboratory-phenotyping panel. Combine WHO confidence grades, isolate counts, and association uncertainty with residue alignment, ligand distance, contact disruption, and local structural environment so that the panel covers both common resistance alleles and mechanistically distinct unresolved variants. Deliver the prioritized panel, an epidemiological evidence table, a structure map, and phenotyping controls; do not recommend therapy.
P3 → Immunology and Biomaterials
Using GEO GSE248524 and the associated source data in PMCID PMC11315930, determine whether the next wound-scaffold experiment should advance the lightly crosslinked hydrogel, retain the heavily crosslinked formulation, or test an intermediate. Perform donor-aware pseudobulk and differential-abundance analyses, distinguish macrophage and fibroblast state changes from compositional shifts, and integrate those results with measured crosslinking, mechanics, degradation, uptake, and tissue infiltration. Nominate one immune–stromal mechanism for perturbation only if it is robust to sensitivity analyses. Deliver a formulation decision, supporting cell-state and material-property figures, one mechanistic experiment, and a concise statement of causal limitations.
P4 → Pharmacogenomics and Population Genetics
Using the GRCh37 1000 Genomes Phase 3 chromosome-10 release dated 20130502 and its sample panel, dbSNP Build 157 records rs4244285, rs4986893, and rs12248560, and ClinPGx/CPIC guideline record PA166251443, decide whether a low-cost research-only CYP2C19 assay should use a universal *2/*3/*17 core or population-specific add-ons. Estimate phased allele and haplotype frequencies by population, audit missingness and Hardy–Weinberg deviations, test whether each SNP tags its stated star allele, and compare total versus worst-population coverage. Deliver the assay specification, per-population coverage with uncertainty, an equity audit, and the evidence that would change the design; do not provide prescribing advice.
P5 → Developmental Toxicology and Placental Biology
Using EPA ToxCast invitroDB v4.2 Version 13 for PFOS (DTXSID3031864) and PFOA (DTXSID8031865) together with the first-trimester maternal–fetal-interface atlas E-MTAB-6701, choose one compound, one trophoblast or decidual cell state, and one molecular endpoint for a mechanistic placental-model experiment. Filter ToxCast curves for assay quality, cytotoxicity, and nonspecific activity, then map credible targets to donor-aware expression and developmental specificity across 6–12 gestational weeks. Deliver a ranked chemical–cell-state–pathway table, the nominated organoid or trophoblast experiment with controls, and separate evidence and speculation sections; do not infer individual risk.
P6 → Single-Cell Biology and Translational Medicine
Using ileal Crohn’s scRNA-seq GSE134809 and the independent pediatric inception cohort GSE134881/SRP216403, derive a cell-state-informed signature of anti-TNF nonresponse and decide whether it merits prospective assay validation. Perform patient-level QC, annotation, pseudobulk contrasts, and signature derivation only in the single-cell cohort; lock the gene panel before testing it against the public response labels in the bulk cohort. Quantify cohort shift, calibration, discrimination, and uncertainty while preventing patient leakage and adjusting for baseline disease activity. Deliver the locked panel, an analysis audit, validation plots, and an advance/redesign/stop recommendation; do not make individual treatment recommendations.
P7 → Radiology and Genomics
Using TCIA’s NSCLC-Radiogenomics collection Version 4 (10.7937/K9/TCIA.2017.7hs46erv) and matched RNA-seq GSE103584/SRP117020, test whether a compact CT-radiomics panel adds reproducible information about tumor pathway activity beyond radiologist semantic annotations. Include only subjects with matched preoperative CT, valid tumor segmentation, and RNA data; standardize image handling, extract segmentation-robust features, derive pathway scores within training folds, and compare semantic-only, radiomics-only, and combined models with nested patient-level validation. Deliver a cohort attrition diagram, locked feature specification, out-of-fold performance with uncertainty, and an advance/retain-semantics/stop decision for external validation.
P8 → Proteomics and Cardiology
Using ProteomeXchange/PRIDE PXD008934, revision 3, identify left-ventricular protein modules that distinguish decompensated heart failure from normal or compensated hypertrophy and remain directionally consistent across ischemic, dilated, and hypertrophic etiologies. Reproduce contaminant and missingness filters on the processed LFQ data, fit age- and sex-adjusted empirical-Bayes contrasts, quantify cross-etiology heterogeneity, and evaluate module stability by leave-one-heart-out analysis and bootstrap resampling. Deliver cross-etiology effect plots, a short ranked module and protein list, and a validate/replicate-first/deprioritize recommendation with an orthogonal experimental plan; do not infer post-translational modifications from abundance data.
P9 → Microbiome Science and Nutrition
Using the fixed 2018 American Gut fecal sOTU table (10.6084/m9.figshare.6137192) and mapping file (10.6084/m9.figshare.6137315), determine whether consuming more than 30 versus 10 or fewer plant types per week is robustly associated with gut microbial ecology after adjustment for antibiotics, age, BMI, geography, sequencing plate, and other dietary variables. Analyze one stool sample per participant with compositional or phylogenetic balances, constrained-permutation beta-diversity tests, missingness analysis, and leave-one-country-out validation. Deliver adjusted effects, balance and transportability diagnostics, and a fund/redesign/do-not-fund decision for a controlled feeding study, including one prespecified microbial endpoint; do not infer microbial function from 16S data alone.
P10 → Digital Pathology and Spatial Statistics
Using Version 2 of the breast-cancer imaging-mass-cytometry dataset 10.5281/zenodo.4607374, determine whether tumor, stromal, and immune-cell organization adds stable prognostic information beyond cell composition and standard pathology variables. Validate phenotypes, masks, and coordinates on a stratified image subset; compute edge-corrected marked spatial statistics and neighborhood enrichment with within-image label permutations; aggregate repeated images at the patient level; and compare composition-only with composition-plus-spatial survival models using patient-grouped nested validation. Deliver QC overlays, a locked spatial-feature panel, incremental out-of-fold performance with uncertainty, and an advance/simplify/stop decision for external validation rather than a clinical predictor.
P11 → Plant Genomics and Climate Adaptation
Using the Arabidopsis thaliana 1001 Genomes 1,135-accession release GMI-MPI v3.1 and WorldClim v2.1 1970–2000 normals, nominate 24 accessions for a drought-by-heat common-garden experiment. Restrict variant extraction to a preregistered stress and phenology gene panel, control genotype–climate associations for ancestry, meta-analyze across ancestry groups, and use BIO5, BIO6, BIO14, and BIO17 at accession coordinates. Select accessions by maximin diversity across genotype, provenance climate, and ancestry rather than association strength alone. Deliver the accession panel, locus-level hypotheses with uncertainty, population-structure diagnostics, and a factorial drought × heat experiment with matched controls.
P12 → Remote Sensing and Crop Science
Within Iowa ROI [-93.75, 41.85, -93.15, 42.22], use Sentinel-2 Collection 1 L2A tile T15TVG acquisitions from 2023-04-06, 05-24, 06-20, 07-10, 08-22, 09-08, and 10-21 together with the 2023 USDA Cropland Data Layer to rank twenty 1-km corn or soybean cells for field scouting. Apply cloud and shadow masks, retain crop-pure pixels, derive NDVI/NDRE establishment, peak-vigor, persistence, and senescence metrics, and pair each robust crop-specific anomaly with a nearby normal control. Deliver a geospatial ranked list, phenology plots, uncertainty flags, and a nitrogen × water follow-up design; do not claim a causal stress diagnosis from imagery alone.
P13 → Marine Ecology and Oceanography
Using the Global Coral Bleaching Database NCEI accession 0228498 Version 1.1 and NOAA daily OISST v2.1 for 1982–2021, identify repeatedly surveyed reefs that bleached less or more than expected from antecedent heat exposure. For each survey, calculate 84-day cumulative positive thermal anomaly, maximum anomaly, and event duration relative to a fixed 1982–2011 local seasonal baseline; fit a grouped model with region and year effects and validate by site. Rank only repeat-survey locations. Deliver resilient and sensitive candidate lists, observed-versus-expected plots with uncertainty, mechanistic hypotheses, and a plan for temperature loggers, symbiont profiling, and controlled heat-tolerance assays.
P14 → Conservation Biology and Infectious-Disease Ecology
Using the USGS national Bd/Bsal survey Version 2.0 (10.5066/P9BGQA1T), USGS GAP Species Range Maps CONUS 2001 v1 (10.5066/F7Q81B3R), and the USGS Watershed Boundary Dataset, prioritize 25 HUC12 watersheds and focal salamander species for a prospective Bsal early-detection survey. Reconcile taxonomy, quantify sampling intensity and unsampled range, weight narrow-ranging taxa, and use set-cover optimization to maximize complementary species coverage. Allocate enough swabs per site for 95% detection probability at 5% prevalence, adjusted for assay sensitivity. Deliver the ranked sites and species, total sampling allocation, detection assumptions, and field/QC protocol; treat GAP ranges as design priors rather than current occupancy and do not present a Bsal occurrence-risk map.
P15 → Microbial Ecology and Environmental Chemistry
Using Tara Oceans MAG distributions from Figshare 10.6084/m9.figshare.4902938.v3, nutrient measurements 10.1594/PANGAEA.875575, and sample registry 10.1594/PANGAEA.875582, identify ten MAGs whose distributions show stable associations with nitrate, phosphate, silicate, or nutrient stoichiometry across ocean regions. Audit sample joins, filter rare MAGs, transform compositional abundances, fit nutrient-association models with false-discovery control, and require stability under leave-one-region-out analysis. Connect robust hits to available functional annotations without treating association as causation. Deliver the ranked MAGs and environments, effect-stability evidence, alternative explanations, and a nitrate × phosphate microcosm experiment with a qPCR or metagenomic readout.
P16 → Climatology and Epidemiology
Using Daymet V4 R1 daily temperature for 1991–2020 (Daymet_Daily_V4R1_2129) and CDC PLACES County Data 2024 (d3i6-k6z5), recommend exactly 25 contiguous-U.S. counties for heat-resilience research grants. Define heat burden as the mean national percentile of annual days with maximum temperature at least 35°C and nights with minimum temperature at least 20°C; define health burden as the mean percentile of age-adjusted CHD, stroke, COPD, diabetes, and disability prevalence; and rank the product of heat burden, health burden, and adult population. Propagate interannual climate variation and PLACES confidence intervals through simulation. Deliver the county table, maps, rank-stability intervals, final allocation, and comparison with heat-only and health-only rankings.
P17 → Air Quality and Labor Economics
Using EPA AQS daily PM2.5 file daily_88101_2023.zip and BLS QCEW 2023_annual_singlefile.zip, estimate county-level construction worker-days exposed to ambient PM2.5 above 35 µg/m³ and recommend 20 counties for a worker-protection study. Deduplicate pollutant-standard rows, define each county-day as the median valid daily mean across distinct monitors, join county FIPS to private-sector QCEW construction industry 1012, and calculate exposed worker-days and wage-bill exposure while handling monitoring gaps and suppressed employment cells. Deliver county rankings, a concentration curve, sensitivity to median versus maximum monitor exposure, and the selected counties; distinguish potential wage exposure from realized economic loss.
P18 → Hydrology and Infectious-Disease Epidemiology
Using California’s West Nile Virus Cases dataset for 2006–2023 (dataset UUID 3205b420-3f62-4a02-8d2e-9a9ed34c49f4) and USGS daily mean discharge parameter 00060/statistic 00003, test whether antecedent streamflow improves prediction of July–December county outbreaks, defined as at least five cases, beyond a non-hydrologic baseline. Retain gauges with at least 80% coverage, standardize flow within gauge and day of year, construct low-flow and dry-to-wet-pulse predictors, and use county/year effects with leave-one-year-out validation. Advance a hydrology trigger only if AUPRC improves by at least 0.05 and calibration slope is 0.8–1.2. Deliver the gauge audit, model comparison, decision, and ten prioritized counties with limitations.
P19 → Seismology and Infrastructure Engineering
Reconstruct bridge-inspection priorities after the 24 August 2014 South Napa earthquake using USGS event nc72282711, reviewed ShakeMap Atlas product nc72282711/atlas/1624995941193, the 2014 California National Bridge Inventory, and FEMA Hazus 6.1 bridge fragilities. Interpolate PGA, SA(0.3 s), and SA(1.0 s) at bridges within MMI VI or greater, map inventory attributes to Hazus bridge classes, propagate shaking and fragility uncertainty, and calculate expected loss-of-function days weighted by average daily traffic. Deliver the exact 20 NBI structure IDs to inspect first, their expected damage and downtime, and the share of predicted network vehicle-days captured, while stating omitted ground-failure and rerouting effects.
P20 → Urban Heat, Demography, and Energy Equity
Allocate 1,000 cooling and weatherization research slots across 2022 census tracts intersecting Richmond, Virginia, using the 2021 NIHHIS–CAPA Richmond heat rasters (OSF project 3xvmg, raster file kw5bc) and DOE LEAD 2022 Virginia data (10.25984/2504170). Summarize afternoon temperature, heat index, and evening temperature by tract; combine these with 0–80% AMI household counts and modeled energy burden; propagate zonal and LEAD uncertainty; and compare joint-priority, heat-only, and energy-only allocations. Allocate proportionally among selected tracts with at least 25 and at most 200 slots per tract. Deliver tract GEOIDs, final counts, three maps, and sensitivity results; treat the heat raster as a campaign snapshot and not household-level risk.
These were not literature-summary questions. They asked each platform to join versioned datasets, apply domain-appropriate quality control and statistical methods, produce machine-readable results and scientific figures, respect causal or clinical boundaries, and preserve enough evidence for another researcher to audit the conclusion.
Both products aim well beyond ordinary chat. K-Dense Web is an autonomous research system with access to more than 250 databases, hundreds of thousands of on-demand tools, and native support for more than 200 scientific data formats. Anthropic describes Claude Science as a workbench that generates figures and manuscripts with their code and environment, preserves explanatory history, reviews artifacts for citation and traceability problems, and runs on a researcher’s own infrastructure.
Claude Science can also route demanding jobs to a connected Modal workspace, including parallel CPU workloads and step-specific GPU work, while the researcher remains in the conversational interface (Modal, 2026). This comparison therefore tested two serious scientific workbenches, not a specialist platform against a generic chatbot.
Product promises were not scored. Computational work often proves difficult to reproduce when software environments and analysis steps are incompletely documented, even when the underlying programs are deterministic (Piccolo and Frampton, 2016). We evaluated the frozen research bundles that the platforms actually delivered.
How the benchmark was scored
Prompt development and platform settings
GPT-5.6 Sol was used to create the benchmark prompts. The prompts were then frozen so every platform faced the same task, required data, deliverables, validation requests, and scientific constraints.
| Platform | Model and mode | Enabled features | Approval and planning settings |
|---|---|---|---|
| Claude Science | Claude Opus 4.8 | Delegation, auto-review, memory, and Modal compute | Default approval settings |
| K-Dense Web | Pro mode; exact model mixture undisclosed and described as combining Google Gemini and Anthropic models | Not separately specified in the run record | “You decide” for questions; default research plan accepted unchanged |
What the judge actually did
Grok 4.5 judged all completed evaluations. Each platform-task result bundle received its own clean-context judge run, with no prior platform or task evaluation available to the judge. The judging procedure was fixed:
- The judge extracted a checklist of the prompt’s explicit inputs, scope, analytical work, comparisons, validation, deliverables, decisions, and constraints. The same frozen checklist was applied to every platform answering that prompt.
- The judge reviewed the exact prompt and submitted result bundle. Credit came only from evidence in the bundle or directly verifiable cited sources; unsupported descriptions of work received no credit.
- The judge inventoried submitted artifacts, checked decision-critical sources and claims, independently recomputed central quantities where possible, attempted to regenerate the main result in a clean environment, and traced the final decision backward through results, code, transformations, and source records.
- The judge assigned an integer 0–4 score to each of 13 criteria, then converted those raw scores to weighted points.
- Every prompt received equal weight in platform-level results. Comparisons used paired prompt-level scores because each platform faced the same task.
The rubric treats two outcomes as co-primary:
| Outcome | Points | What it asks |
|---|---|---|
| Scientific quality | 75 | Is the work correct, complete, evidence-based, appropriately validated, and decision-useful? |
| Research execution | 25 | Can the work be regenerated, traced to its sources, recreated in a specified environment, and reused? |
| Secondary composite | 100 | The sum of the two outcomes, used as a summary rather than a substitute for either axis |
Each criterion received an integer raw score from 0 to 4. A 0 meant absent, fabricated, contradicted, or fundamentally wrong; 1 meant minimal or seriously flawed; 2 meant partially correct with a material omission or error; 3 meant substantially correct with only minor defects; and 4 required complete, correct, specific, and auditable evidence. Weighted points were calculated as criterion weight × raw score ÷ 4.
Scientific quality (75 points)
| Criterion | Weight |
|---|---|
| A. Task fulfillment | 13 |
| B. Evidence and data integrity | 11 |
| C. Methods and validation | 13 |
| D. Result correctness and reasoning | 11 |
| E. Robustness and uncertainty | 6 |
| F. Decision quality and follow-up | 6 |
| G. Scientific narrative and structure | 5 |
| H. Claim precision and epistemic honesty | 5 |
| I. Figures, tables, and deliverable usability | 5 |
| Total | 75 |
Research execution (25 points)
| Criterion | Weight |
|---|---|
| R1. Executable regeneration | 8 |
| R2. Source lineage and acquisition | 7 |
| R3. Environment and determinism | 5 |
| R4. Traceability and reusable outputs | 5 |
| Total | 25 |
Together, these weights sum to the 100-point secondary composite. The weights encode prespecified priorities. Scientific validity receives three quarters of the total, with the greatest scientific weight on task fulfillment, methods, evidence integrity, and correctness. Research execution receives one quarter, with regeneration and source lineage weighted most heavily because they directly test whether a result can be recovered and connected to its inputs. The weights are normative rather than empirically estimated natural constants.
This design separates scientific quality from research execution because they measure different properties. A result can be persuasive but impossible to audit, or reproducible but scientifically wrong. The prompt-specific checklist preserves content validity across disciplines, while evidence-only scoring reduces halo effects from confident writing, apparent effort, workflow complexity, and presentation polish. Integer anchors, a published linear formula, and no hidden bonuses or score caps keep judgment bounded and interpretable.
The protocol emphasized verification rather than plausibility through source inspection, numerical recomputation, clean-environment regeneration, and backward tracing from decisions to code and data. Fairness came from the same prompt checklist, judge settings, evidence rules, and access policy for each platform, plus equal prompt weights and paired comparisons.
GPT-5.6 Sol was initially attempted as the judge, but refusals prevented any evaluations from being completed with it. Platform identity was visible because it could be inferred from submitted artifacts. To the best of our knowledge, Grok 4.5 was not used by any evaluated platform, which reduces but does not eliminate the risk of platform-specific self-preference.
The composite remains a secondary summary rather than the sole basis for declaring a winner. Components and composites were rounded separately from their underlying values, so displayed sums can differ by 0.1 point.
K-Dense Web won more tasks, but the domain mattered
K-Dense Web led 14 prompt-level composites and Claude Science led six. K-Dense’s largest advantages appeared in infectious-disease genomics, microbiome science, proteomics, plant genomics, and several cross-domain environmental tasks. Claude’s largest advantages appeared in immunology and biomaterials, climatology and epidemiology, and infrastructure engineering, with additional leads in radiogenomics, marine ecology, and remote sensing.
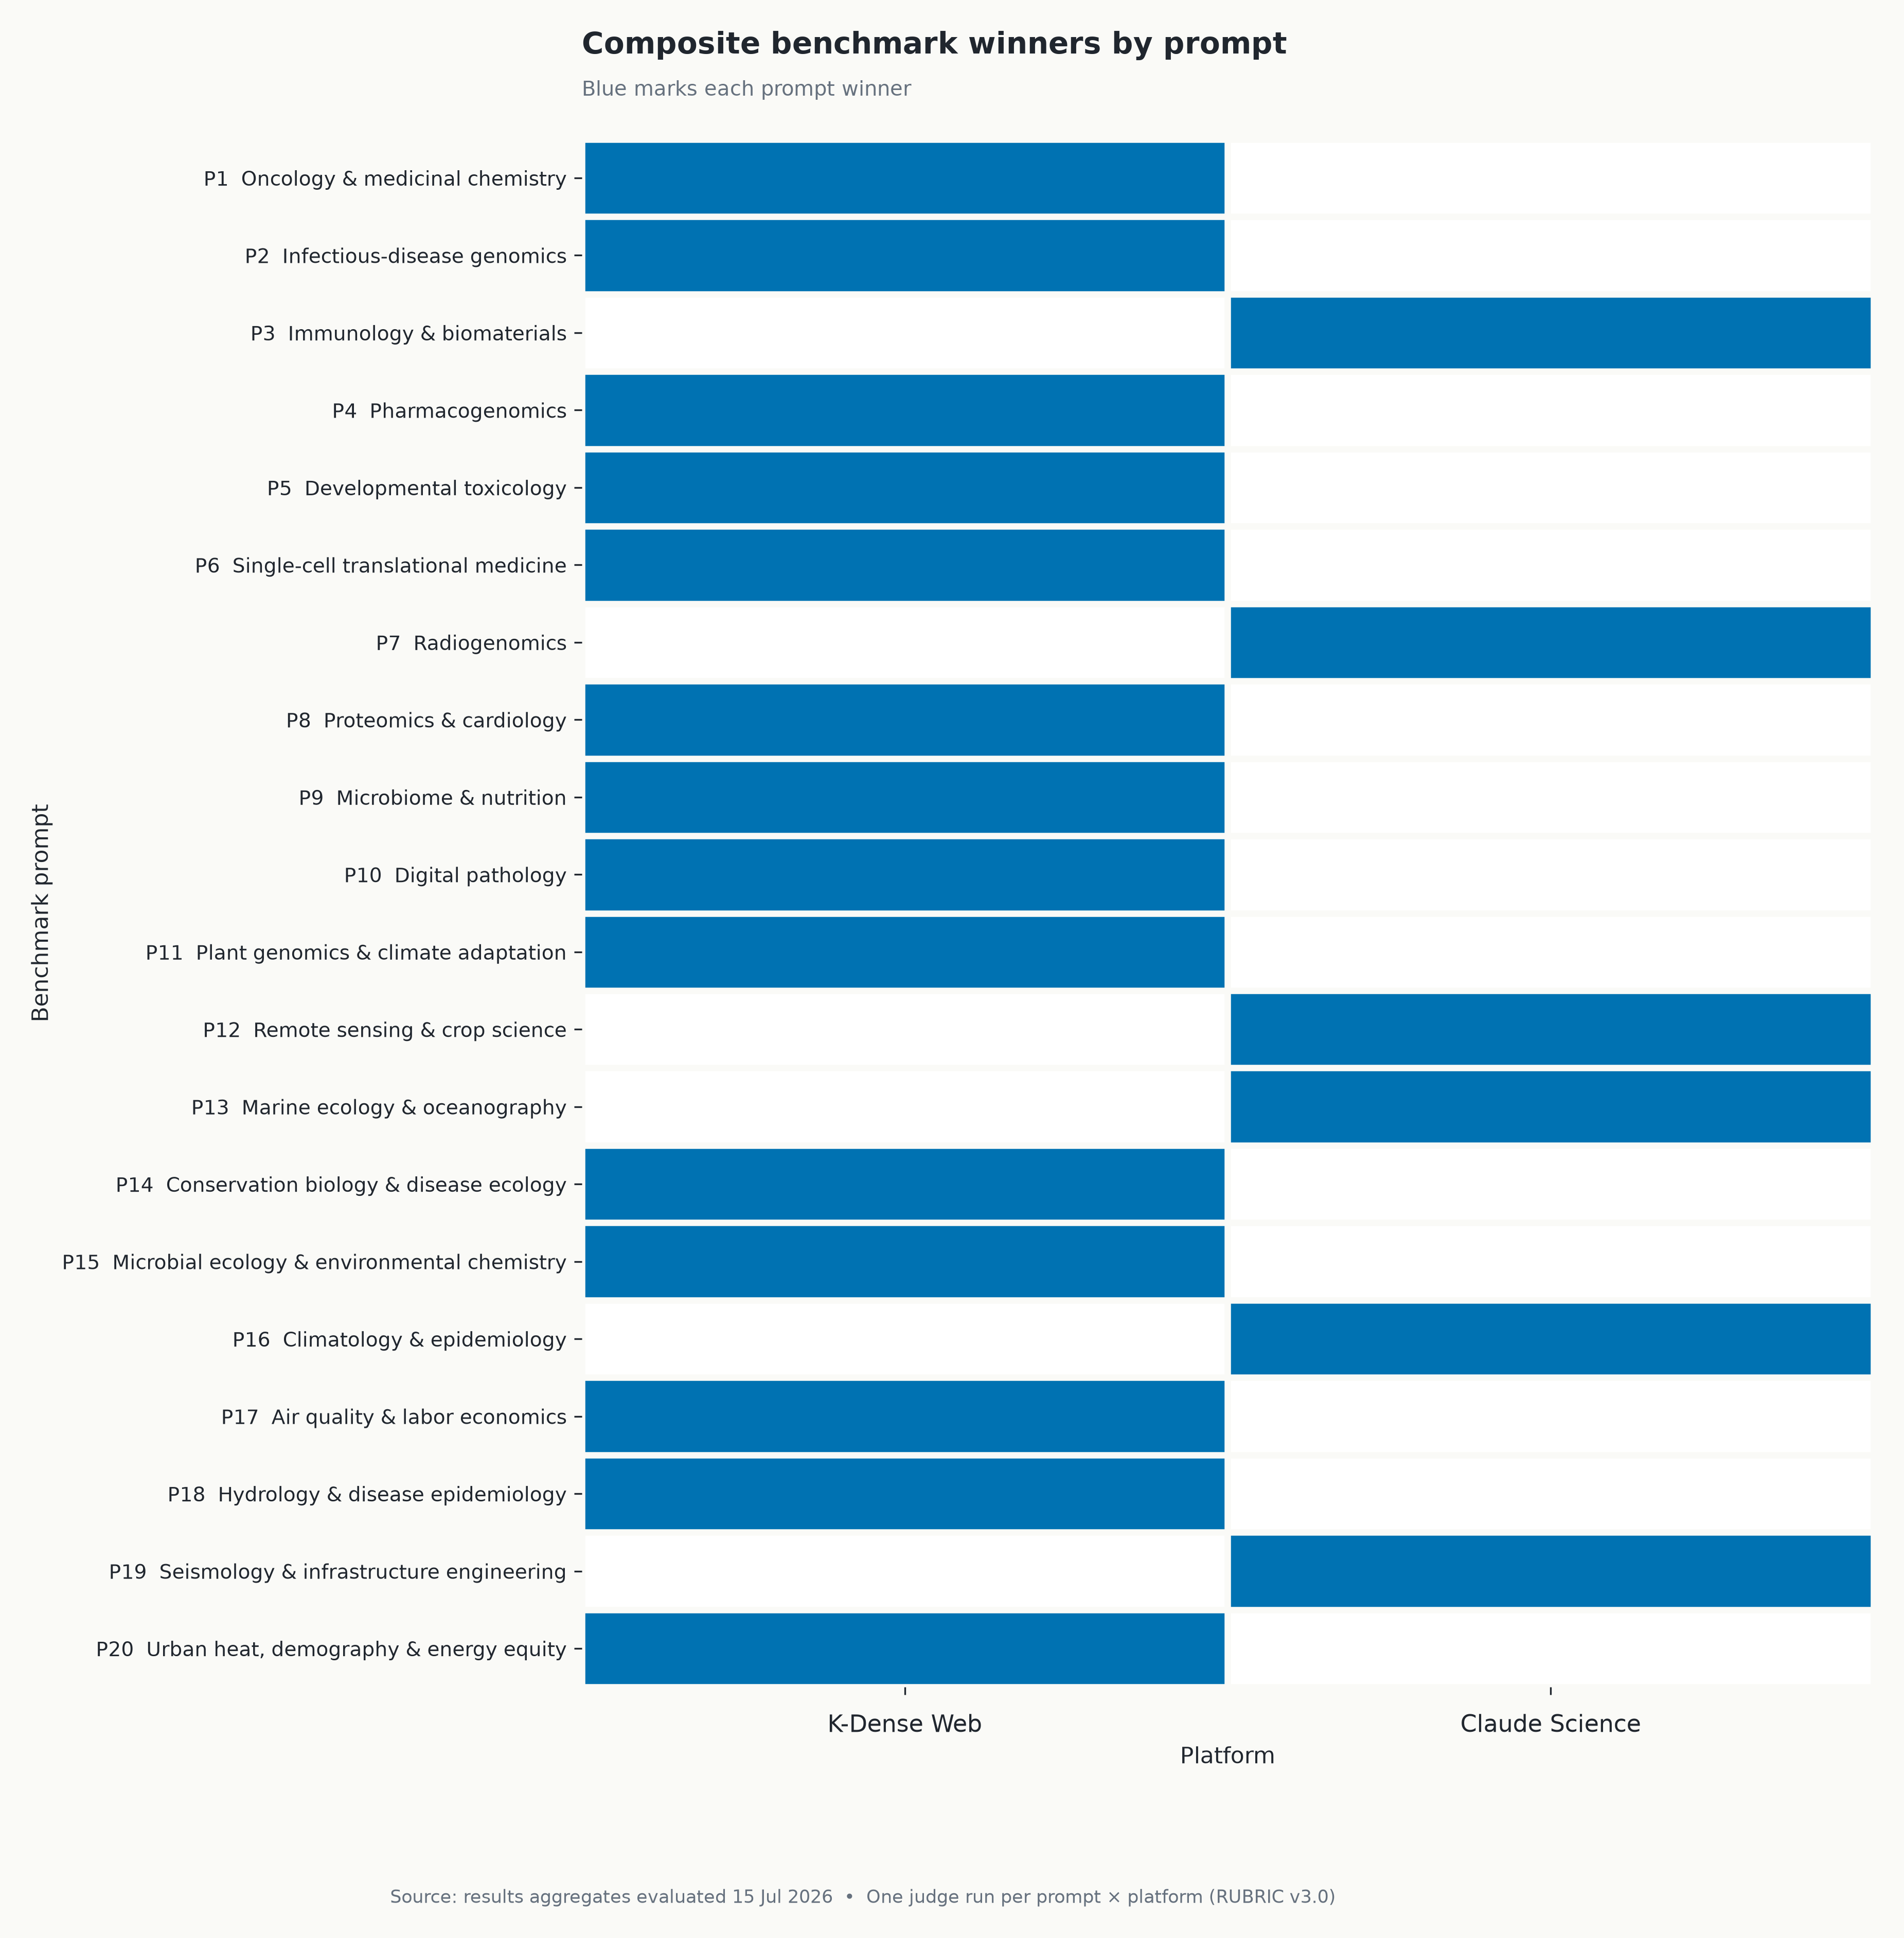
Figure 1. Prompt-level secondary composites. K-Dense Web’s advantage was broad but not universal: it led prompts 1, 2, 4–6, 8–11, 14–15, 17–18, and 20. Claude Science led prompts 3, 7, 12–13, 16, and 19.
The paired mean composite difference was +6.0 points for K-Dense Web. An exploratory paired bootstrap interval crossed zero, with an approximate 95% interval from −0.9 to +12.6. The benchmark therefore does not establish a stable overall composite advantage beyond this task set.
The direction was nevertheless reasonably robust to individual prompts. In a leave-one-prompt-out sensitivity check, K-Dense’s mean composite advantage remained positive, ranging from +4.2 to +7.8 points. That is descriptive evidence of breadth, not proof that the same margin will recur on a new benchmark.
The clearest advantage was the chain of evidence
K-Dense’s research-execution difference was larger and much more consistent than its composite difference. It averaged 14.7/25, or 59% of available execution points, compared with 6.4/25, or 26%, for Claude Science. K-Dense scored higher on execution in every paired task, and the exploratory 95% bootstrap interval for the mean difference of +8.3 points was approximately +7.0 to +9.4.
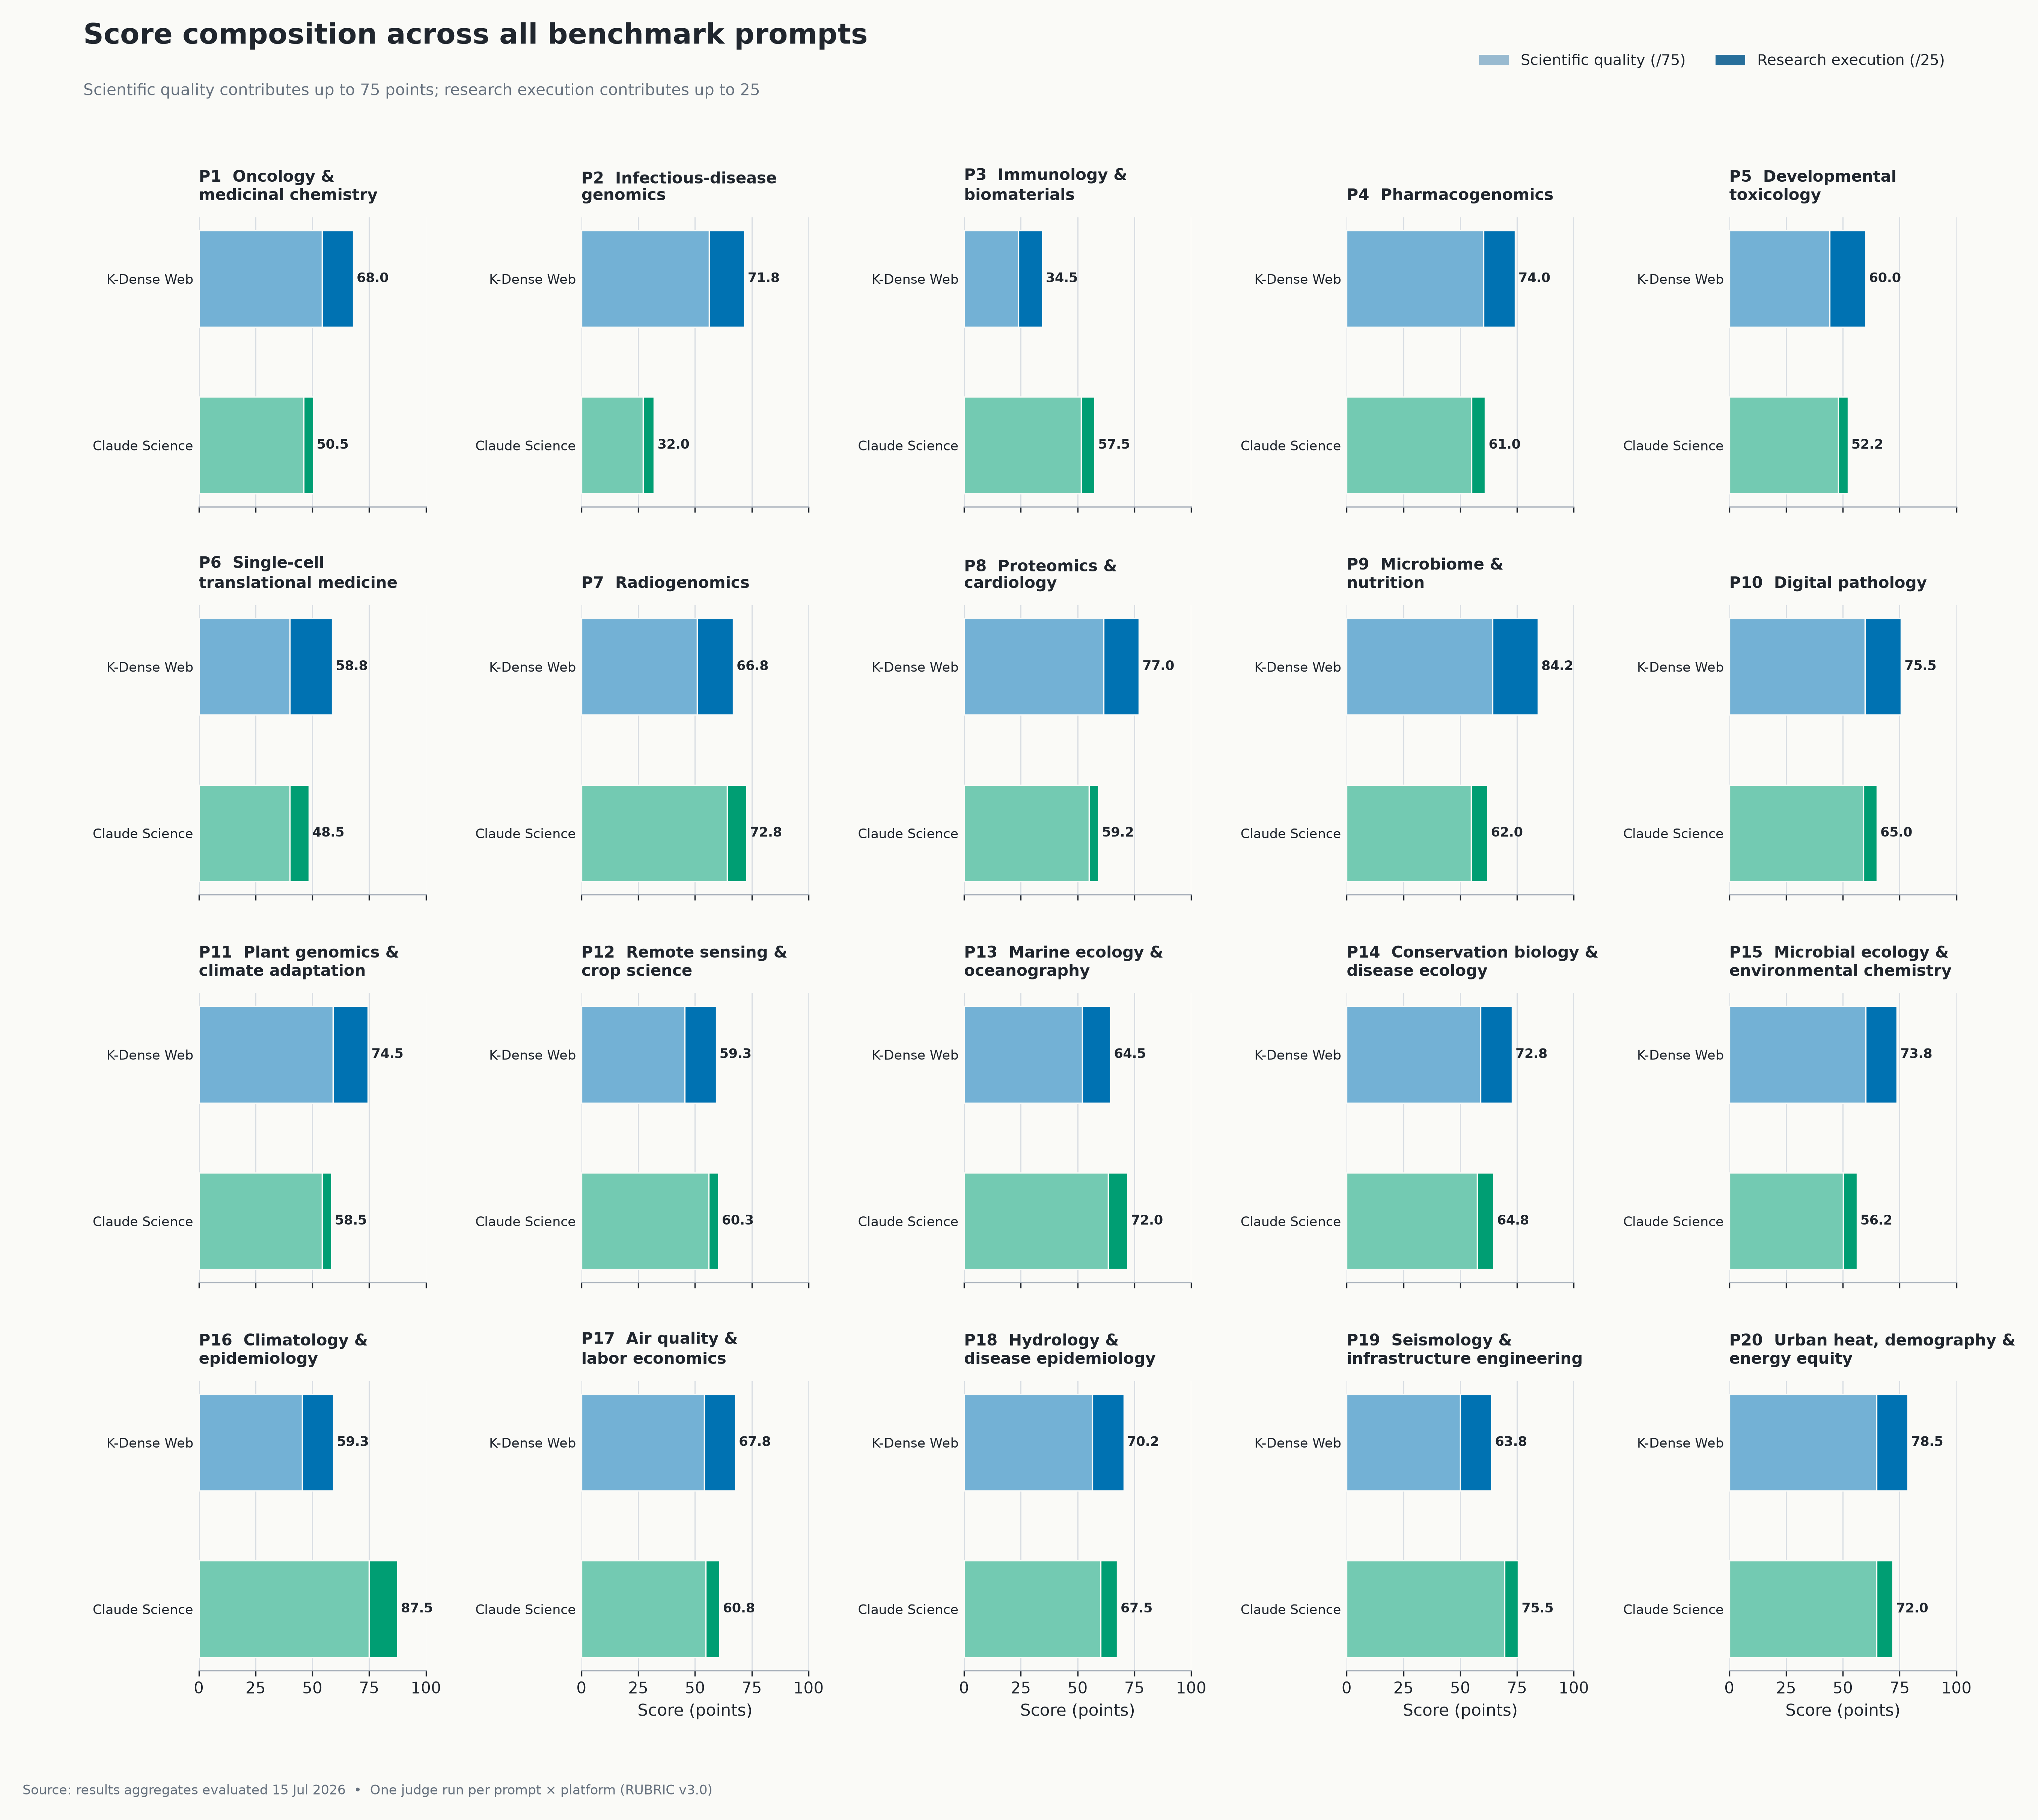
Figure 2. Scientific quality contributes up to 75 points and research execution up to 25. The recurring K-Dense advantage appears in the darker execution segment, not as an across-the-board scientific-quality lead. Separately rounded components can differ from the printed composite by 0.1 point.
The largest K-Dense margin came from the infectious-disease genomics task. The prompt required an rpoB substitution panel grounded in a pinned WHO mutation catalog and the rifampicin-bound structure PDB 5UHB. K-Dense scored 71.8, compared with 32.0 for Claude Science.
That 39.8-point gap is the largest in either direction across the benchmark. It supports a clear task-level claim, but not a universal one: Claude led other domains by similarly meaningful margins, and detailed prompt-level judge summaries are not included in this published package.
The American Gut microbiome task was K-Dense’s strongest result at 84.2, compared with 62.0 for Claude Science. Read together with K-Dense’s 20-of-20 execution lead and the criterion profile below, these task-level results show where the platform’s advantage accumulated: not in uniformly higher scientific scores, but in bundles that received more credit for regeneration, source lineage, environment specification, and reuse.
Claude Science sometimes did the better science
Scientific-quality leadership was evenly divided: each platform led nine prompts, with two ties. Claude Science averaged 55.3/75, or 74% of available points, while K-Dense averaged 53.1/75, or 71%. The paired difference favored Claude by 2.2 points on average, but varied widely by task; the exploratory 95% bootstrap interval for K-Dense minus Claude was approximately −8.1 to +3.5.
The most important counterexample was the climatology and epidemiology task. Claude Science scored 87.5, the highest score in the comparison, while K-Dense scored 59.3. Claude achieved the maximum 75.0/75 scientific-quality score on that prompt and added 12.5/25 for execution.
Claude also led the radiogenomics prompt, 72.8 to 66.8, even though the score composition plot shows K-Dense ahead on execution there. These public score breakdowns make the broader point without relying on unpublished judge notes: better packaging does not guarantee better science.
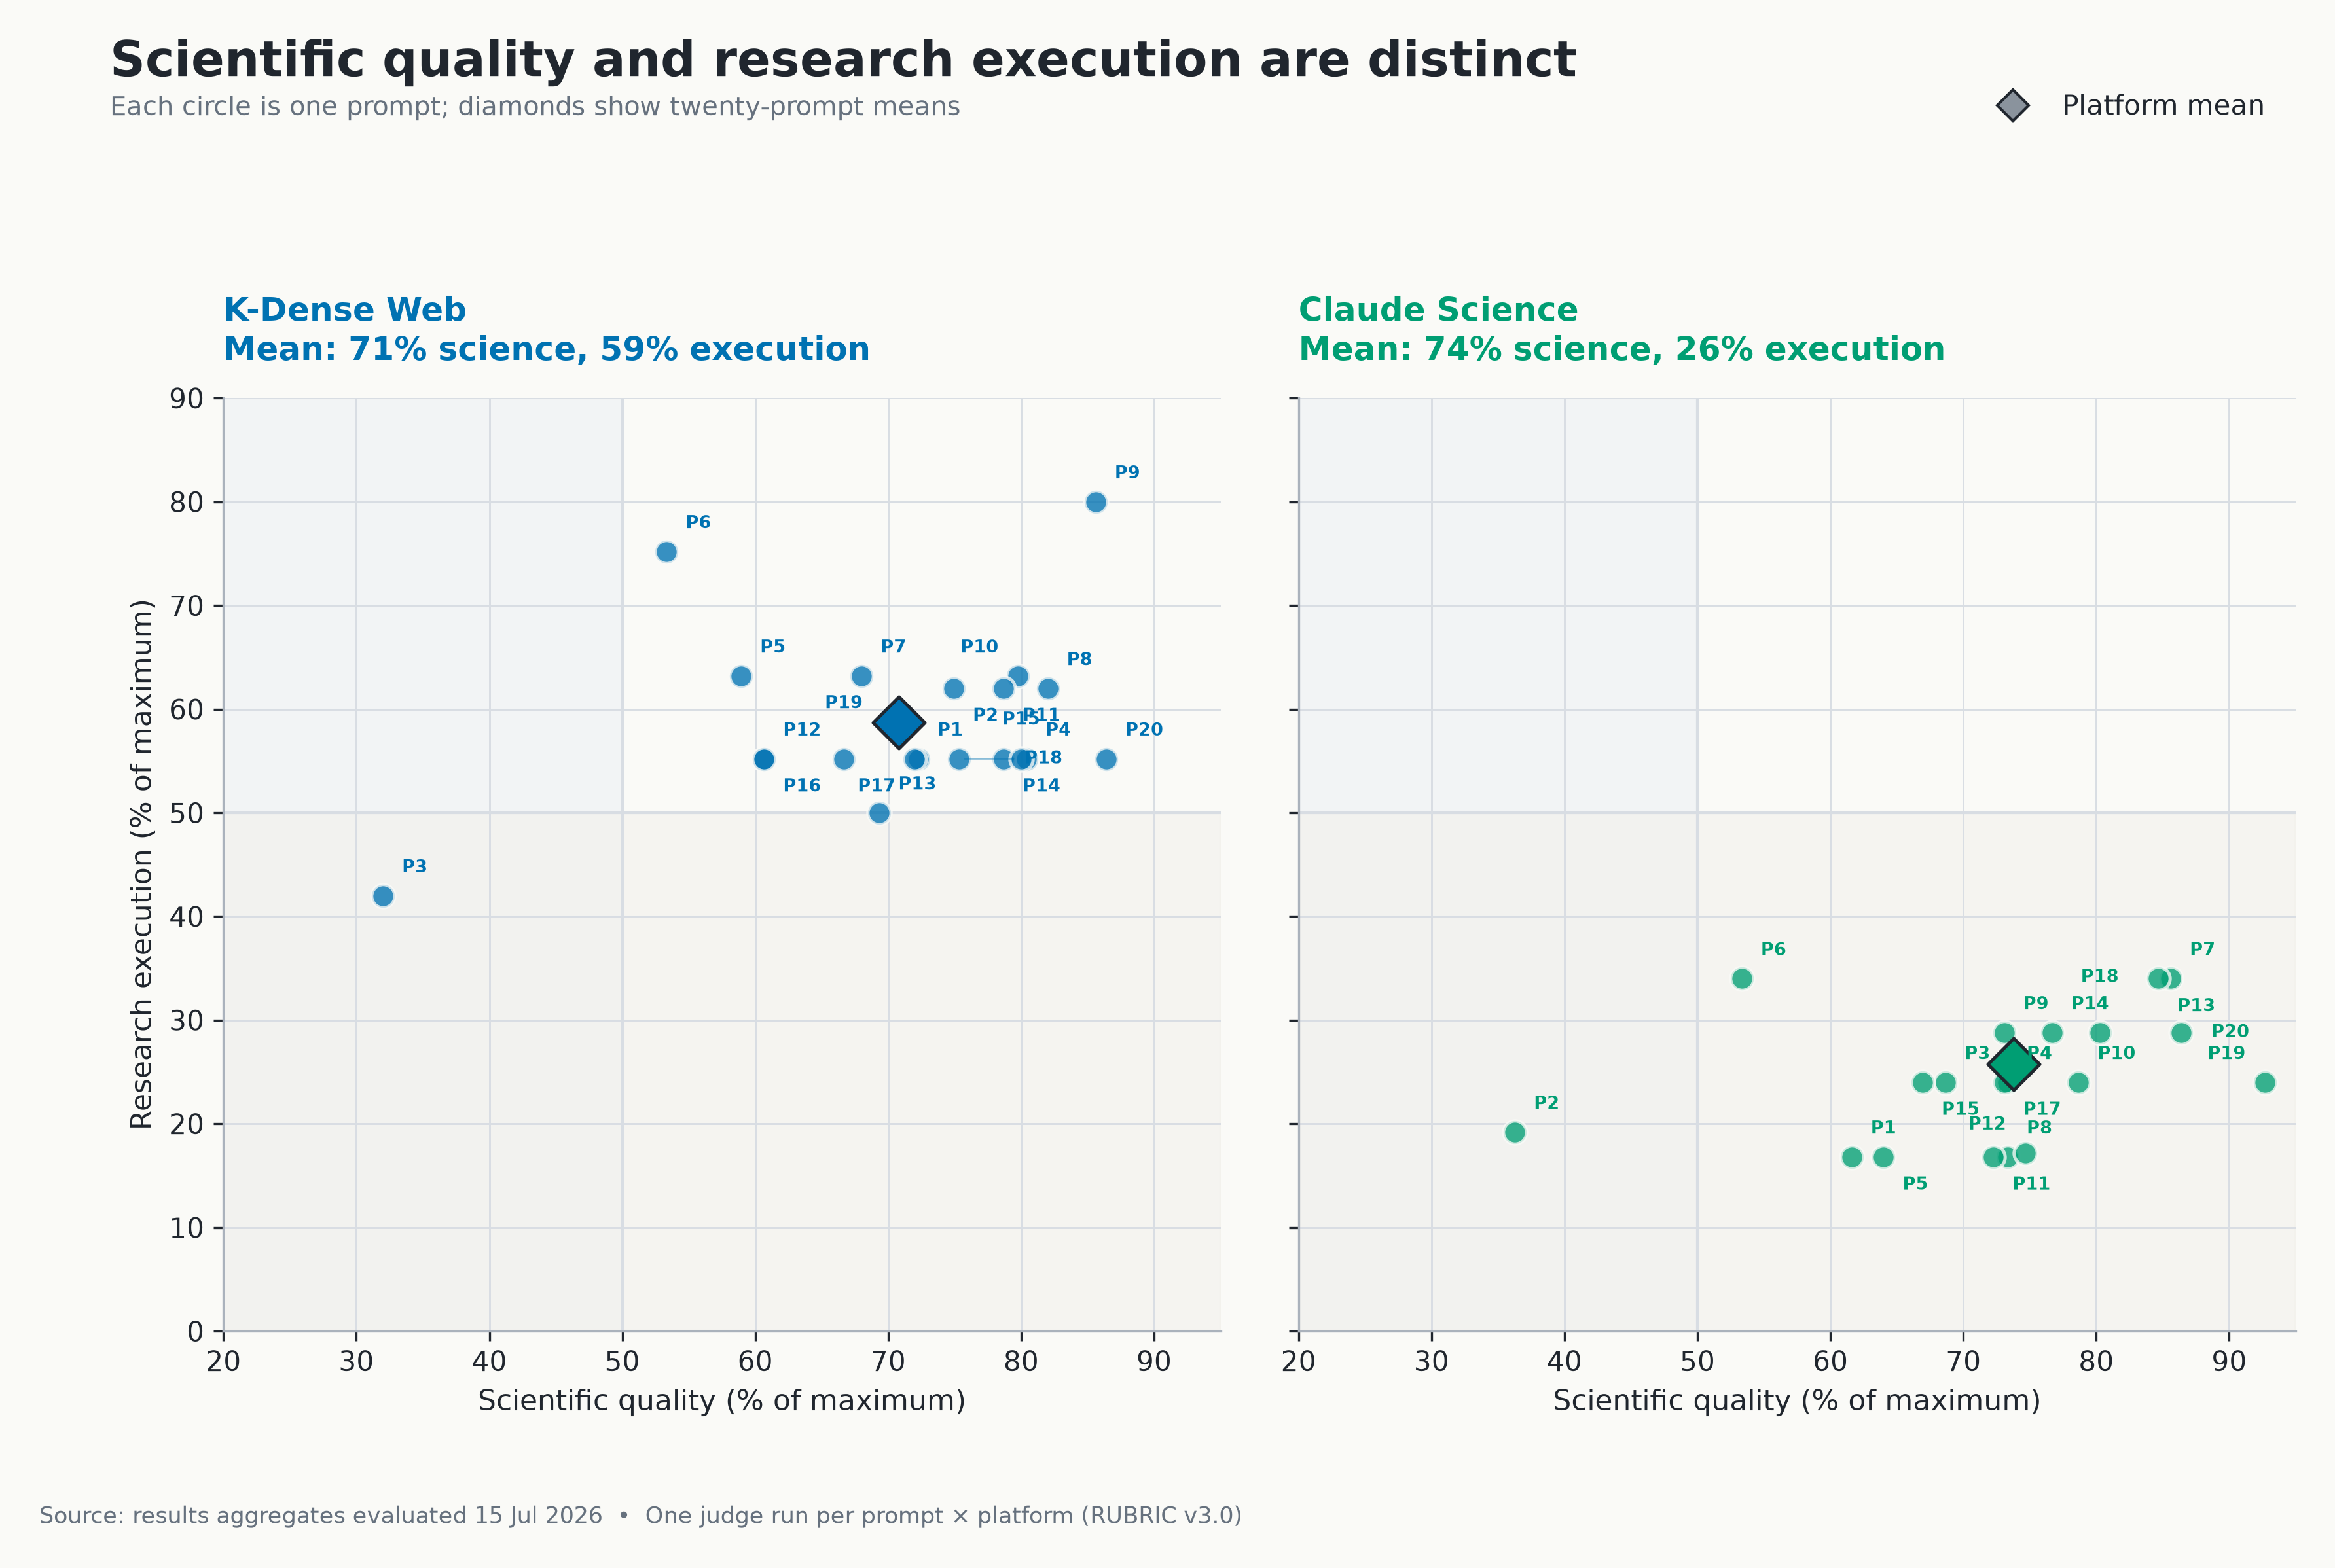
Figure 3. Each circle is one prompt and each diamond is a platform mean. Claude Science sits farther right on average; K-Dense Web sits substantially higher. Claude’s P16 result, 100% scientific quality and 50% execution, is beyond the current chart’s 95% x-axis limit and is clipped from view, but it is included in Claude’s mean. The 50% guides are visual references, not pass/fail thresholds.
These losses sharpen the recommendation. K-Dense Web should be chosen for its observed consistency in producing an auditable research object, not because it is immune to scientific mistakes. Definitions, cohorts, assumptions, and decision-critical calculations still require expert review.
Consistency also favored K-Dense Web
K-Dense’s median composite was 69.1, compared with 60.9 for Claude Science. Its scores ranged from 34.5 to 84.2, while Claude’s ranged from 32.0 to 87.5. Both platforms had serious failures, and Claude produced both the highest single score and several of the largest task-specific wins.
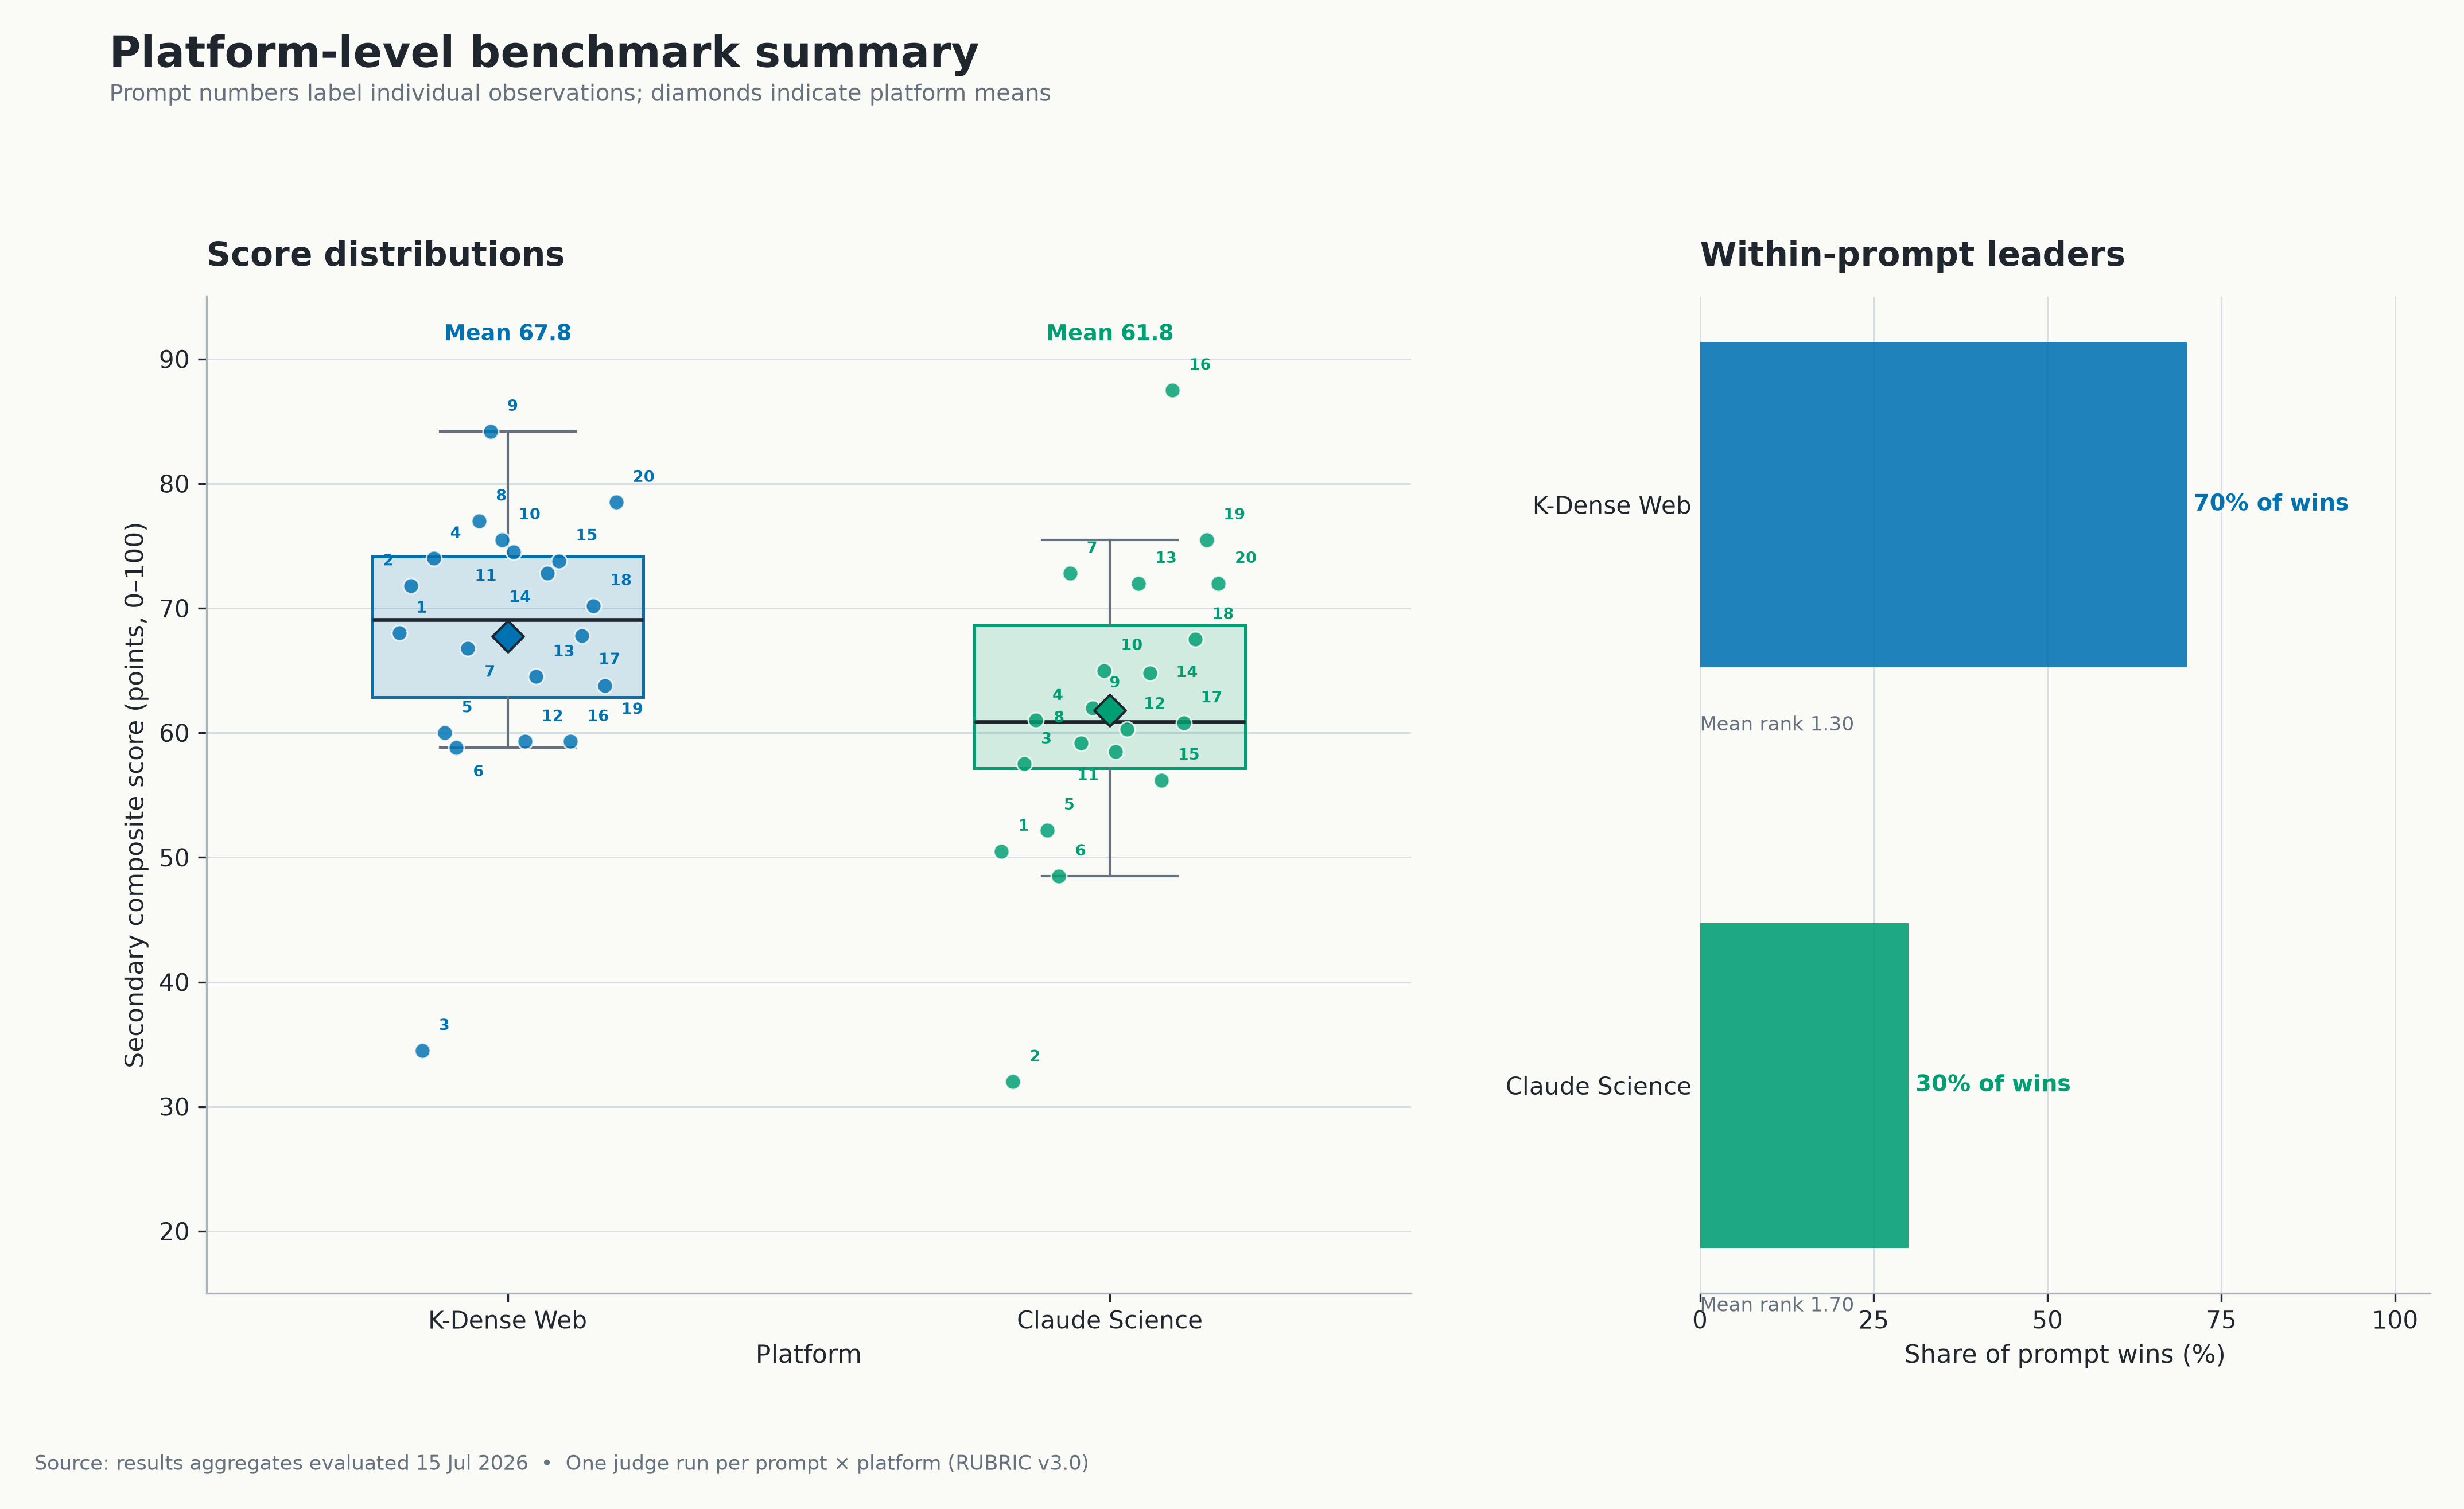
Figure 4. K-Dense Web led 14 of 20 prompt-level composites and had the higher median. Boxes show the interquartile range, numbered points identify prompts, and diamonds mark platform means. These distributions describe this fixed task set; they do not represent judge run-to-run uncertainty.
The result is not simply that K-Dense had fewer low scores. The paired comparisons changed direction by domain, but K-Dense more often combined a usable scientific answer with the machinery needed to challenge, revise, or extend it.
The criterion profile explains why
Complete criterion-level profiles were available for 16 of the 20 prompts. Claude Science led five mean scientific criteria: task fulfillment, methods and validation, correctness and reasoning, decision quality and follow-up, and claim precision. K-Dense led evidence and data integrity, robustness and uncertainty, narrative and structure, figures and usability, and all four research-execution criteria.
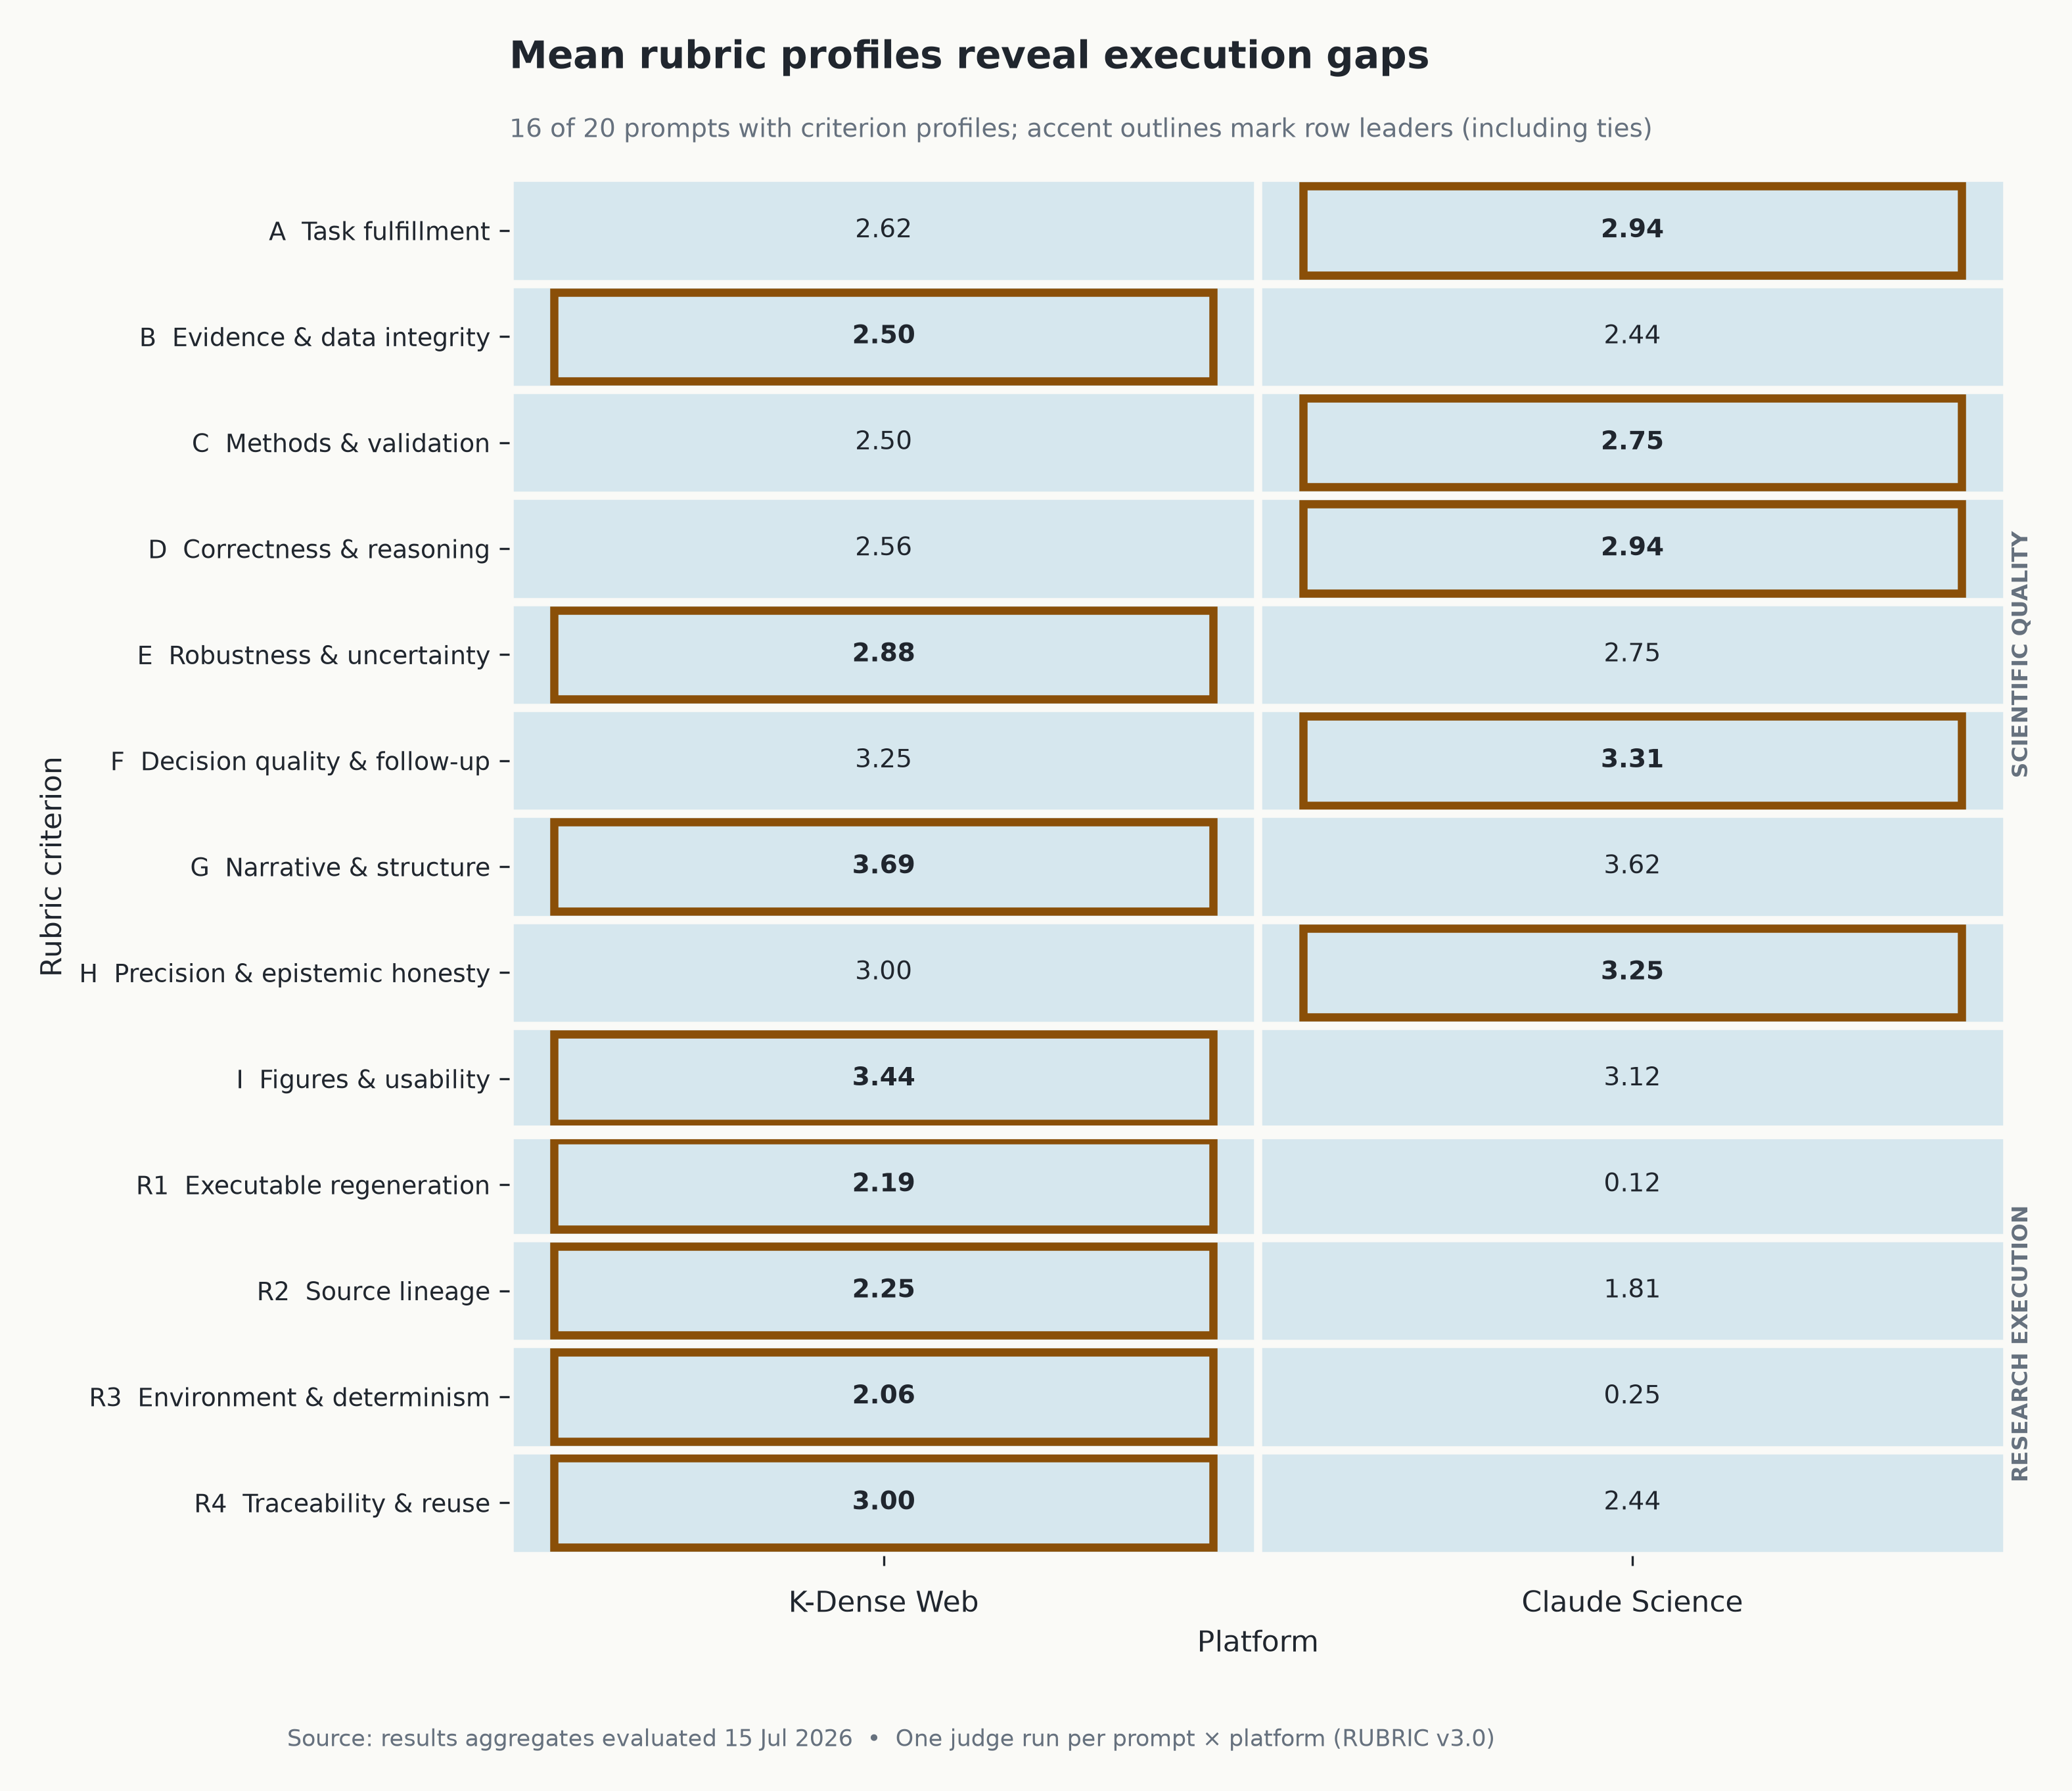
Figure 5. Mean raw 0–4 criterion scores for the 16 prompts with complete profiles. K-Dense’s clearest advantage is below the divider: executable regeneration, source lineage, environment specification, and traceability. The means are unweighted and exclude P1, P10, P11, and P19.
The largest gaps were in executable regeneration and environment specification. K-Dense averaged 2.19/4 on regeneration versus 0.12/4 for Claude, and 2.06/4 on environment and determinism versus 0.25/4. K-Dense also led source lineage, 2.25 to 1.81, and traceability and reuse, 3.00 to 2.44.
Those numbers should not be oversold. Scores near 2 indicate partial performance under the rubric, so K-Dense’s lead does not mean complete reproducibility. It means the submitted K-Dense bundles more often preserved enough of the computational chain to inspect and reuse meaningful parts of the work.
Anthropic says Claude Science includes the code, environment, message history, and reviewer checks associated with generated artifacts (Anthropic, 2026). Those are the right product goals. In this benchmark, however, the submitted Claude Science bundles often did not preserve enough of that machinery for the evaluator to regenerate the decision-critical workflow.
Which platform should a scientist choose?
Based on these 20 tasks, K-Dense Web is the stronger default when the research product itself must survive the conversation. Its advantage matters most when a lab needs:
- An audit trail, not only a narrative. K-Dense more often preserved workflow code, machine-readable outputs, source records, and links between them.
- A reusable handoff. Its bundles were more likely to give a collaborator something concrete to inspect without reconstructing the original session.
- Visible uncertainty. Across the 16 complete criterion profiles, K-Dense earned the higher mean score for robustness and uncertainty.
- A research object that can be corrected. Retained code, tables, figures, intermediate artifacts, and source lineage make errors easier to locate and repair.
- Execution across varied domains. K-Dense’s prompt leads spanned biomedical, ecological, geospatial, engineering, and population-data tasks.
Claude Science remains a formidable option. Its best results show that it can outperform K-Dense decisively, and its modestly higher average scientific-quality score matters. It may be the better fit when the immediate analysis is the priority, when work must remain on lab-controlled infrastructure, or when a team already has strong practices for exporting, versioning, and pinning every artifact.
The benchmark suggests that the choice is not simply between two reasoning systems. It is between two delivered research products, and the work left behind can matter as much as the prose shown on screen.
What this benchmark does and does not prove
This is evidence from a finite, deliberately difficult task set, not a universal ranking of scientific intelligence. The following limitations bound every conclusion in this article:
- One fresh-context Grok 4.5 judge run scored each prompt-platform bundle, so judge run-to-run variability was not measured.
- Platform identity was visible because it could be inferred from the submitted artifacts.
- The rubric’s 75/25 weighting is normative.
- The underlying model stacks differed and were not fully disclosed.
- Cost, latency, interface quality, and human effort were not scored.
- Detailed prompt-level judge summaries and raw aggregate files are not included in this published package.
- The benchmark was produced by K-Dense, one of the evaluated platforms.
- The results are not independent expert validation, clinical validation, or proof of superiority across science.
The honest conclusion remains actionable. K-Dense Web showed a large, consistent research-execution advantage and the higher overall score across these 20 tasks. Claude Science showed a modestly higher average scientific-quality score and several exceptional task-specific results. For a lab that values research that can be audited, revised, rerun, and handed to the next scientist, that execution advantage makes K-Dense Web the better default in this comparison.
Sources
- Claude Science, an AI workbench for scientists (Anthropic, June 30, 2026)
- Anthropic integration with Modal brings scalable compute to Claude Science (Modal, June 30, 2026)
- K-Dense: AI Agents for Real Research (accessed July 15, 2026)
- Scientific Agent Skills (accessed July 15, 2026)
- Tools and techniques for computational reproducibility (Piccolo and Frampton, 2016)