What this research found
Whether India's air pollution has crossed a statistical tipping point was tested against the World Bank's national annual PM2.5 series for 1990 to 2020, then extended into city-level modeling of New Delhi, Mumbai, Bengaluru and Hyderabad. Change-point tests place a break at 2011, with the national mean rising from 59.73 to 68.43 µg/m³ and peaking at 79.04 µg/m³ in 2014, though neither the break nor the underlying trend clears the 0.05 significance level. Every year in the 31-year record exceeds both the WHO guideline and India's own standard.
- Pettitt's test locates a change point at 2011, where the national annual mean PM2.5 shifts from 59.73 µg/m³ before to 68.43 µg/m³ after, a jump of 8.70 µg/m³. The result falls short of conventional significance at p = 0.0818.
- Over the full 1990 to 2020 record the Mann-Kendall test finds no significant monotonic trend, with Kendall's tau of 0.1957 at p = 0.126. The movement is episodic rather than a steady climb.
- Segmenting the series with the PELT change-point algorithm yields four breaks — 2008, 2012, 2015 and 2018 — bracketing a 2012 to 2014 crisis period averaging 76.43 µg/m³, followed by a decline to 58.80 µg/m³ across 2018 to 2020.
- All 31 years exceed both the WHO annual guideline of 5.0 µg/m³ and India's National Ambient Air Quality Standard of 40 µg/m³, with no year falling inside either. The lowest reading in the record, 48.39 µg/m³, came in 2020.
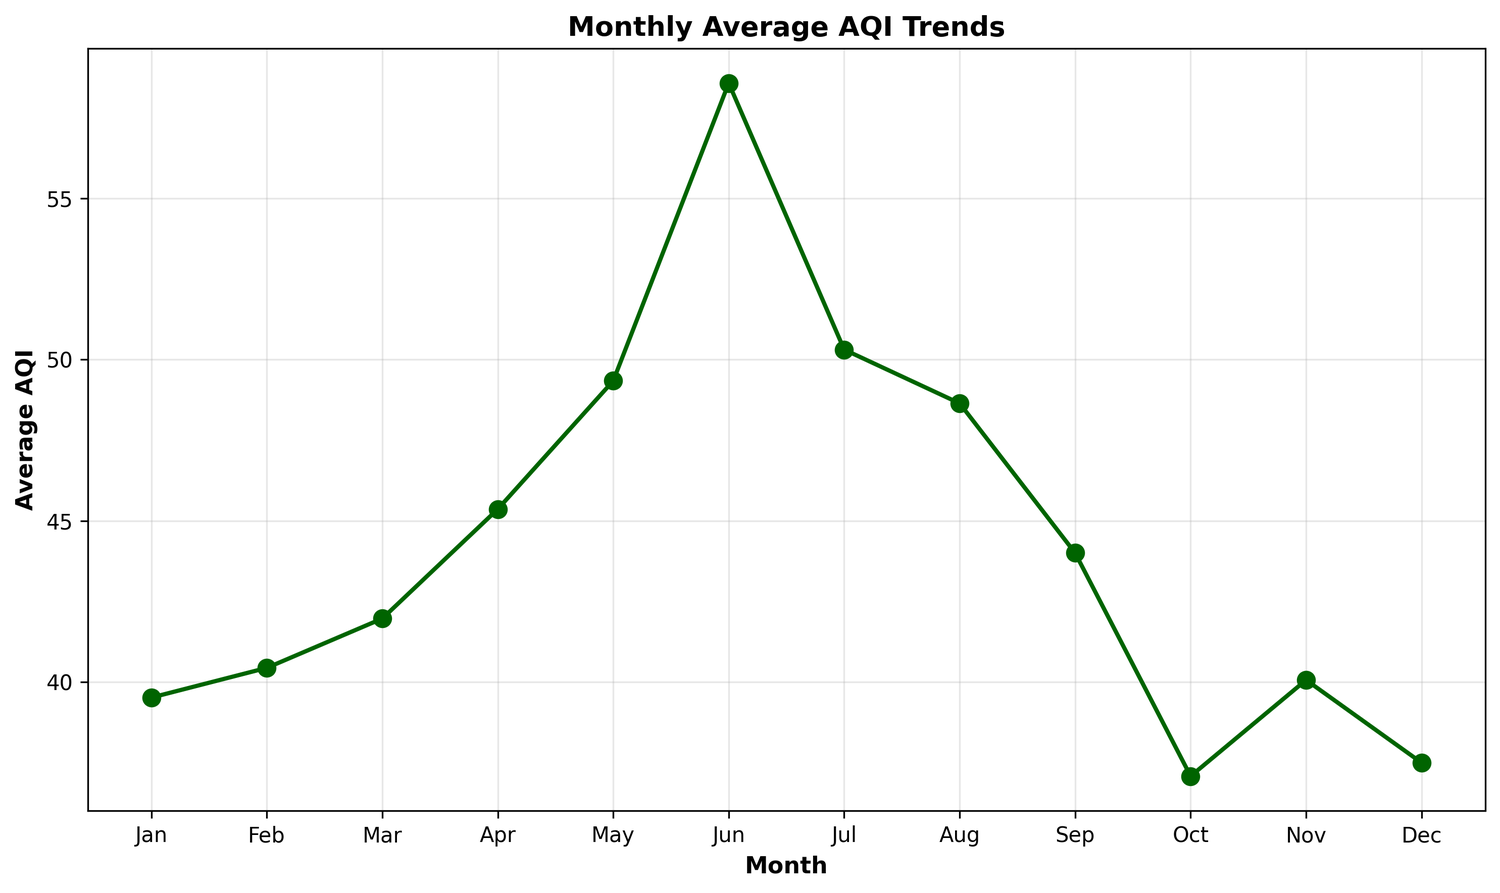
- In the city-level model, which runs on synthetic daily data rather than measurements, monthly PM2.5 moves almost in lockstep across the four cities at an average pairwise Pearson correlation of 0.966. New Delhi averages 149.8 µg/m³ against Bengaluru's 60.2 µg/m³, and all four peak between November and February.
- Holt-Winters models fit those city series with root-mean-square errors from 3.09 µg/m³ for Bengaluru to 7.28 µg/m³ for New Delhi, and their 24-month projections keep every city above both thresholds in every month.
How it was done
The World Bank's mean annual PM2.5 exposure indicator for India supplied 31 valid yearly observations from 1990 to 2020, which were tested for monotonic trend using Mann-Kendall, for a single structural break using Pettitt's test, and for multiple regime shifts using the PELT algorithm. Real city-level daily histories could not be obtained: the OpenAQ endpoints were unavailable, and a current-conditions pull returned Shanghai stations mislabeled as Indian cities and was discarded. A synthetic 43,836-record daily dataset spanning 2015 to 2024 was therefore generated to stand in for typical patterns, and it fed the seasonal decomposition, cross-city correlation and Holt-Winters forecasting. The work was written up as a 24-page technical report and an 18-slide deck with five figures.
Data sources
- World Bank Development Indicators — mean annual PM2.5 exposure for India, 1990–2020 (31 valid annual values, 4 missing)
- Synthetic daily series for New Delhi, Mumbai, Bengaluru and Hyderabad — 43,836 records covering January 2015 to December 2024, generated for demonstration
- WHO annual PM2.5 guideline of 5.0 µg/m³ and India's National Ambient Air Quality Standard of 40 µg/m³
- AQICN current-conditions API — 4 city records retrieved, then excluded as invalid
- 18 peer-reviewed citations, including Global Burden of Disease work in Lancet Planetary Health
Limitations
The city-level results — synchronization, severity ranking, seasonality and forecasts — rest on synthetic daily data generated because real city histories were not retrievable, so they demonstrate the method rather than measure actual air quality. The single real series is a national annual average, and neither its trend nor its 2011 break reaches statistical significance.
Figures from this analysis
Outputs produced
historical_macro_data.csv
World Bank annual PM2.5 pollution data for India (1990-2020)
aqicn_current_data.csv
Current AQI readings for 4 cities from AQICN API
synthetic_daily_data.csv
Synthetic daily pollution measurements for 4 cities (2015-2024)
Comprehensive data acquisition report with source status and recommendations
Initial OpenAQ v2 data acquisition script (deprecated API)
OpenAQ v3 data acquisition attempt (API endpoints unavailable)
02_alternative_data_acquisition.py
Multi-source data acquisition script - FINAL WORKING VERSION (World Bank + AQICN + synthetic data)
Data harmonization and preprocessing script (cleaning, validation, aggregation)
What this would have cost
This session was one of 67 audited against what a qualified specialist would spend producing the same deliverable alone, at mid-market US consulting rates.
Order-of-magnitude estimates (±30%) by design. The human baseline assumes one specialist working full-time without queueing or meetings, and excludes data and software licensing. The K-Dense figure is the credits a session consumed, valued at the Plus rate. What you are actually charged is capped per run — $9 at Standard, $29 at Pro — so the real gap is wider than shown. Full methodology.
How this research was produced
K-Dense Web planned and ran this environment investigation end to end — gathering the sources, carrying out the analysis, producing the figures, and drafting the report. The full session transcript, including every intermediate step, is available to view.