What this research found
How much information about which specific photograph a mouse is looking at survives the step from primary visual cortex into a higher visual area? Using two-photon calcium imaging from the Allen Brain Observatory, K-Dense decoded which of 118 natural scenes was shown on each trial from populations of layer 2/3 excitatory neurons. Primary visual cortex identified the correct scene on 17.8% of held-out trials against a 0.85% chance level, while the posteromedial higher visual area managed 9.6% — and the gap persisted when both were compared at the same neuron count.
- From 152 neurons in primary visual cortex, the decoder named the exact scene on 17.8% of held-out trials and placed it in its top five on 39.4%, roughly 21 and 46 times the 1 in 118 chance level of 0.008475, with 1,050 of 5,900 pooled trials correct.
- The higher visual area decoded at 9.6% top-1 and 22.1% top-5 from 128 neurons — still about 11 times chance, so scene information is attenuated rather than erased beyond primary cortex.
- The advantage was not a population-size artifact. Subsampled to a matched 128 neurons, primary cortex still reached 0.159 top-1 against 0.096, a gap of 0.064 that places the higher area 15.5 standard deviations below the subsampled distribution — an accuracy matched by only about 50 to 55 primary-cortex neurons.
- Accuracy rose monotonically with population size and had not saturated at 152 neurons, climbing from 0.033 top-1 at 10 neurons through 0.141 at 100. Standard deviations stayed at or below 0.009, meaning accuracy depends on how many neurons are used rather than which ones.
- Decodability varied sharply by scene. In primary cortex 81% of the 118 scenes were decoded above chance and 25 exceeded 0.3 top-1 accuracy, against 58% and 13 scenes in the higher area, and errors were diffuse rather than concentrated on particular scene pairs.
How it was done
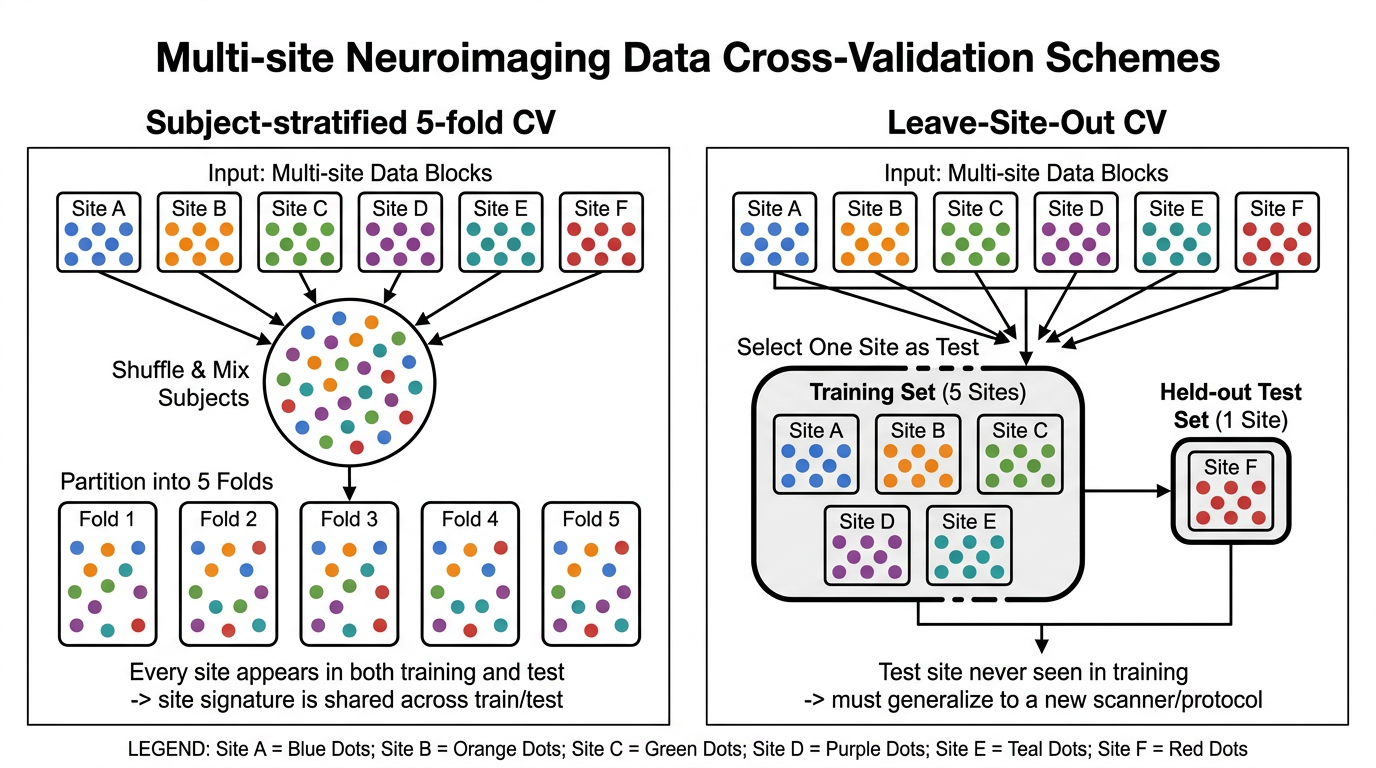
Because each two-photon experiment images one area in one mouse at one depth, a within-animal cross-area contrast is impossible, so one primary-cortex experiment and one posteromedial experiment were selected and matched on every controllable variable: the same Cre driver line and GCaMP6f reporter, 175 micrometer imaging depth, session type, and closely matched age, and the identical stimulus of 118 scenes at 50 repeats each. Fluorescence traces were aligned to each stimulus onset and averaged over a fixed 0 to 500 millisecond window, giving 5,900 trials by 152 or 128 neurons. An L2-regularized multiclass linear decoder was evaluated under a deliberately leak-free scheme: trials were ordered in acquisition time and split into five contiguous blocks, a 15-frame embargo purged training trials adjacent to each test block, and per-neuron standardization and regularization-strength selection were fit inside training folds only. Zero response-window overlaps were verified for all ten folds. A subsampling analysis drew ten random neuron subsets at each of nine population sizes.
Data sources
- Allen Brain Observatory Visual Coding two-photon dataset, accessed via AllenSDK 2.16.2 — two matched layer 2/3 experiments, 5,900 natural-scene trials each
- de Vries et al., Nature Neuroscience 23:138-151 (2020) — the standardized physiological survey underlying the dataset
- Siegle et al., Nature 592:86-92 (2021) — electrophysiological survey establishing the functional hierarchy of mouse visual areas
- Stringer et al., Nature 571:361-365 (2019) — high-dimensional geometry of visual cortical population responses
Limitations
The comparison rests on two experiments and therefore two mice and two sessions, so animal-specific factors such as expression level, behavioral state, or imaging quality cannot be fully excluded as contributors to the area difference; it should be read as a case study rather than a population-level estimate. Calcium fluorescence is a slow, nonlinear proxy for spiking, so the reported accuracies are lower bounds on the information in the underlying spike trains, and the analysis covers only superficial excitatory neurons at a single depth with a linear read-out.
How this research was produced
K-Dense Web planned and ran this neuroscience investigation end to end — gathering the sources, carrying out the analysis, producing the figures, and drafting the report. The full session transcript, including every intermediate step, is available to view.