What this research found
A feasibility study asked whether non-invasive scalp electroencephalography (EEG) can predict seizures early enough to trigger closed-loop brain stimulation, and whether wearable autonomic sensors could stand in for EEG altogether. A random forest separated pre-seizure from inter-ictal EEG windows with a ROC-AUC of 0.986 ± 0.016 at a five-minute lead time. The heart-brain coupling proposed as the wearable link, however, proved negligible and uncorrelated with the states it was meant to track.
- Random forest discriminated pre-seizure from inter-ictal 30-second windows with a mean ROC-AUC of 0.986 ± 0.016 and PR-AUC of 0.817 ± 0.175, ahead of XGBoost at 0.965 ± 0.026. F1 stayed low and unstable at 0.400 ± 0.370, reflecting thresholds tuned toward specificity.
- Predictive signal concentrated in bilateral temporal and frontal electrodes. Right temporal T8 variance ranked first at 0.0507 importance, followed by central Cz alpha power and left frontal pole Fp1 variance, suggesting a roughly 10-channel sensor set could carry most of the performance.
- Heart-brain phase-amplitude coupling was weak, with a mean modulation index of 0.0134 ± 0.0052 against the 0.3 or higher seen in strong coupling, and it tracked neither arousal (r = -0.156, p = 0.667) nor valence (r = -0.133, p = 0.714). The conclusion was that it adds no meaningful predictive value.
- On the affective proxy task, peripheral-only sensors beat the full EEG-plus-peripheral feature set, reaching ROC-AUC 1.00 ± 0.00 for valence and 0.80 ± 0.45 for arousal versus 0.50 and 0.40. With only 10 trials, each cross-validation fold held about two trials, so scores collapsed to 0 or 1 rather than forming a smooth curve.
- Bayesian logistic regression placed the pre-seizure coefficient at β = 3.47 with a 95% highest-density interval of 2.11 to 5.23 and r_hat of 1.00, giving explicit uncertainty bounds alongside the point estimate.
How it was done
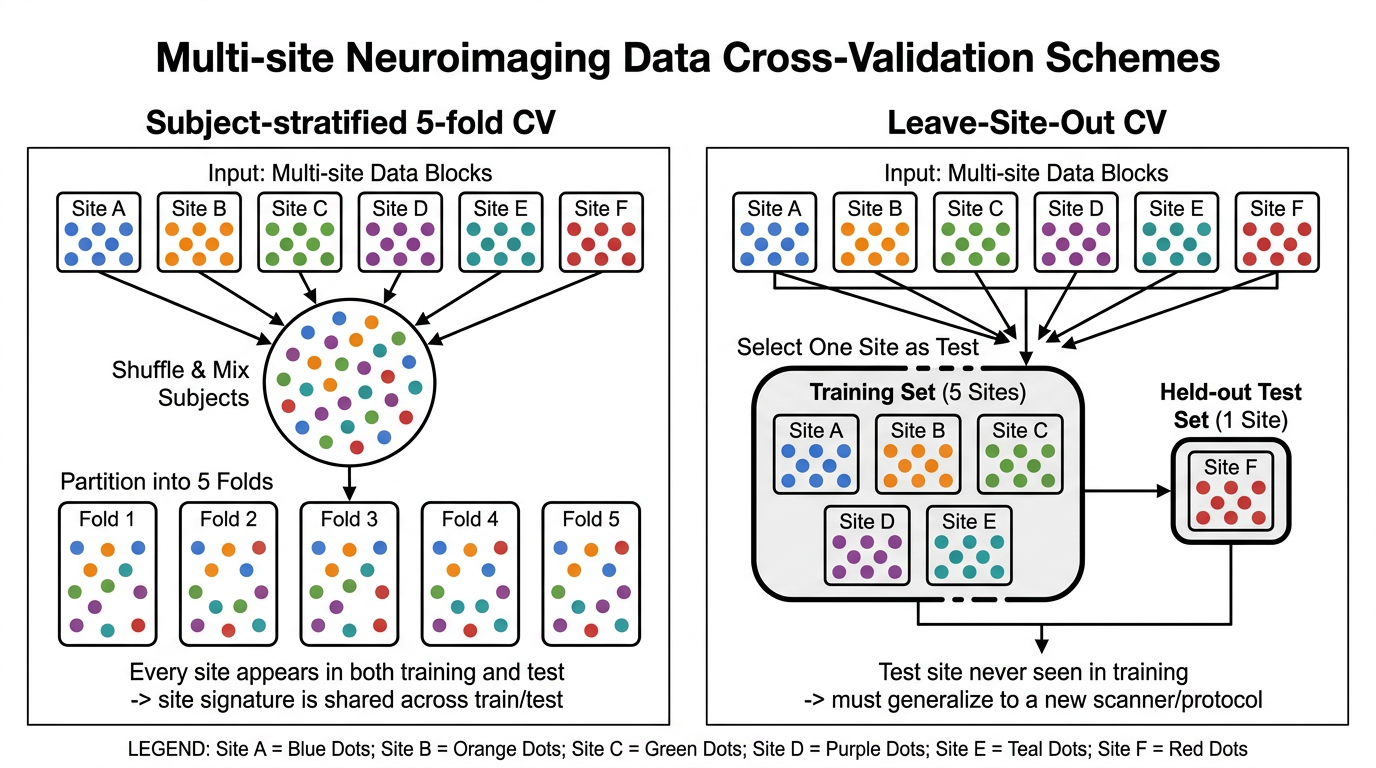
Roughly three hours of 23-channel scalp EEG from a single pediatric patient in the CHB-MIT database were bandpass and notch filtered, then cut into 327 thirty-second windows: 10 pre-seizure and 317 inter-ictal, a 1:32 imbalance. Ten features per channel — relative power in five frequency bands, permutation entropy, Lempel-Ziv complexity, variance, skewness, and kurtosis — gave 230 predictors for random forest and XGBoost classifiers, validated by 5-fold stratified cross-validation with SMOTE oversampling and feature scaling applied inside each fold to prevent leakage. The wearable arm used DEAP-style physiological recordings of 10 trials to compare peripheral-only sensors against the full EEG-plus-peripheral set, and cardiac-to-gamma phase-amplitude coupling was quantified by mean vector length. The work was written up as a 22-page manuscript with five figures and 22 verified references.
Data sources
- CHB-MIT Scalp EEG Database (PhysioNet) — subject chb01, 3 recordings, 23 channels at 256 Hz, one expert-annotated seizure
- DEAP-style physiological recordings — synthetic proof-of-concept data, 2 subjects, 10 trials, 32 EEG plus 8 peripheral channels
- 22 peer-reviewed references with verified DOIs, including Koelstra et al. 2012 on DEAP and Shoeb 2009 on CHB-MIT
Limitations
The seizure model was trained on a single pediatric patient with one annotated seizure, so generalization to other patients and seizure types is untested. The wearable comparison relied on synthetic DEAP-like data with only 10 trials, which the write-up itself calls statistically underpowered proof-of-concept.
What this would have cost
This session was one of 67 audited against what a qualified specialist would spend producing the same deliverable alone, at mid-market US consulting rates.
Order-of-magnitude estimates (±30%) by design. The human baseline assumes one specialist working full-time without queueing or meetings, and excludes data and software licensing. The K-Dense figure is the credits a session consumed, valued at the Plus rate. What you are actually charged is capped per run — $9 at Standard, $29 at Pro — so the real gap is wider than shown. Full methodology.
How this research was produced
K-Dense Web planned and ran this neuroscience investigation end to end — gathering the sources, carrying out the analysis, producing the figures, and drafting the report. The full session transcript, including every intermediate step, is available to view.