What this research found
How far ahead can a US recession actually be seen? Nineteen monthly Federal Reserve Economic Data (FRED) indicators covering 1994 to 2024 were expanded into 205 engineered features and handed to three families of forecaster — probit and logit econometric benchmarks, Random Forest and XGBoost, and a Bayesian logistic model — all scored on 240 out-of-sample months with expanding-window validation. Predictability proved sharply horizon-dependent: a simple financial-conditions logit won at three months with an area under the receiver operating characteristic curve (AUC-ROC) of 0.8407, XGBoost won at six months at 0.7514, and at twelve months every model landed at or below random chance.
- At the three-month horizon the simplest model wins. A logit on just the yield curve, credit spread, and volatility index reached 0.8407 AUC-ROC, ahead of XGBoost at 0.8135 and Random Forest at 0.7900 — neither machine learning model beat it.
- At six months machine learning pulls ahead: XGBoost scored 0.7514 against the 0.6007 benchmark, a 25.1% improvement, with Random Forest at 0.6530 (+8.7%).
- Twelve months out, nothing works. The best score was 0.4584 from the yield-curve probit, with XGBoost at 0.4270 and Random Forest at 0.3506 — all at or below the 0.5 random baseline, and XGBoost registered precision and recall of exactly 0.0000 at a 0.5 threshold.
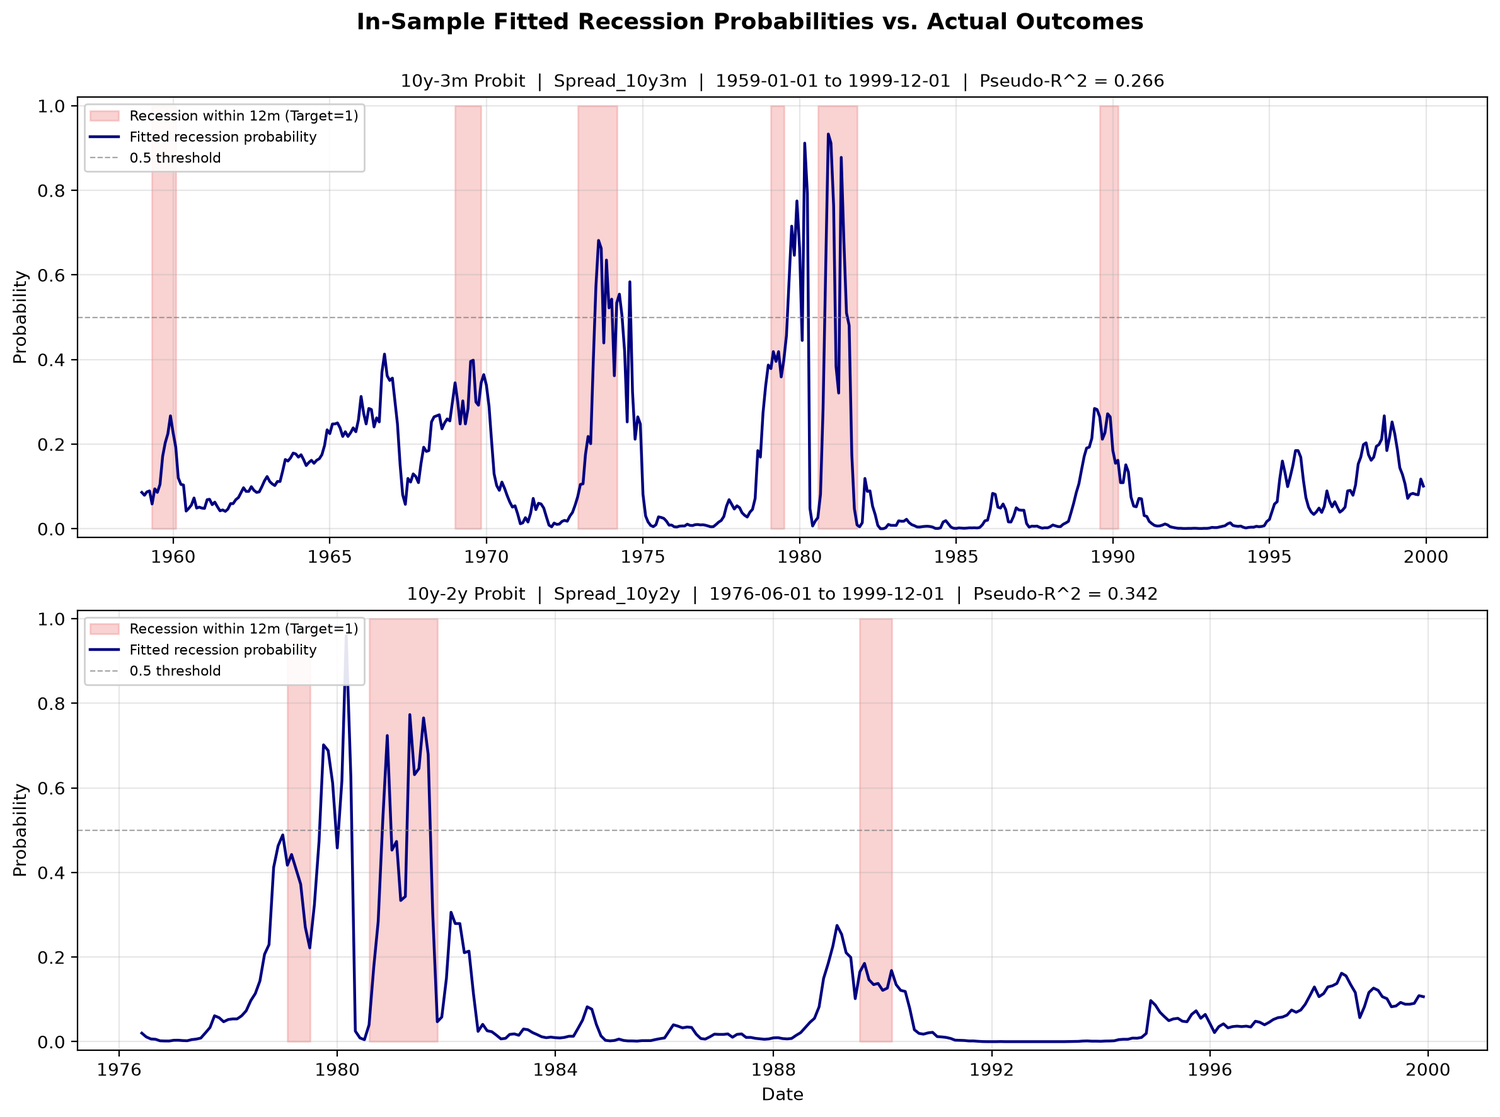
- The classic yield-curve probit performed poorly once look-ahead bias was removed, scoring 0.3898 at three months and 0.1409 at six, both below random ranking.
- Commercial and industrial loan volume, not the yield curve, dominated the best six-month model, carrying 0.198 of XGBoost's feature importance, followed by the six-month average of initial jobless claims lagged twelve months (0.089), the 10-year-minus-2-year Treasury spread lagged six months (0.069), and industrial production lagged six months (0.062).
- The Bayesian model quantified how little is really pinned down: of five inputs, only industrial production lagged six months had a 95% highest-density interval excluding zero (coefficient 1.379, interval 0.407 to 2.405), and credible intervals on the predictions averaged 0.5313 in width across 108 test months.
How it was done
Monthly series were pulled from FRED into one harmonized panel — Treasury and credit spreads, volatility, jobless claims, unemployment, industrial production, capacity utilization, retail sales, consumption, housing starts and permits, home prices, money supply, business loans, and consumer sentiment — with the NBER-based recession indicator as the target. Year-over-year and month-over-month changes, three- and six-month rolling statistics, and lags of 1, 3, 6, and 12 months turned 19 base indicators into 205 features over 372 months, of which augmented Dickey-Fuller tests judged 129 stationary. Every model was scored by expanding-window walk-forward validation: an initial 1994 to 2004 training window, then 240 monthly out-of-sample predictions through 2024, with each training window truncated by the forecast horizon so no observation inside the prediction window could leak into fitting. A Bayesian logistic regression over the top five XGBoost features added credible intervals, and results were written up as an 18-page paper with 25 verified citations and an interactive dashboard.
Data sources
- Federal Reserve Economic Data (FRED) — 19 monthly macroeconomic indicators, 1994 to 2024, 372 months after feature engineering
- NBER-based US recession indicator — 20 recession months across the 240-month evaluation period (8.33% prevalence)
- Estrella and Mishkin yield-curve probit specification, used as the econometric benchmark
Limitations
Twelve-month forecasting failed outright, with no model beating random ranking, and the Bayesian analysis found only one of five inputs statistically credible. Because the evaluation window contains just 20 recession months out of 240, all precision and recall figures rest on very few positive events.
Figures from this analysis
Outputs produced
FIXED data ingestion script - addresses critical data corruption issue from previous iteration
consolidated_macro_data.csv
FIXED consolidated monthly economic dataset - no data corruption, proper historical variation
Comprehensive data summary with quality validation, comparison to previous iteration, and fix documentation
[OLD] Feature engineering pipeline - replaced by corrected version
02_feature_engineering_corrected.py
[CORRECTED] Feature engineering pipeline with proper methodology: YoY/MoM transformations, rolling statistics, comprehensive lags, stationarity analysis
data_processed.csv
[OLD] Feature-engineered dataset - replaced by corrected version
feature_engineered_data.csv
[CORRECTED] Feature-engineered dataset with proper methodology: 372 rows × 208 columns (205 features + 3 targets)
feature_engineering_report.txt
[CORRECTED] Comprehensive feature engineering report with stationarity analysis (129/205 features stationary)
What this would have cost
This session was one of 67 audited against what a qualified specialist would spend producing the same deliverable alone, at mid-market US consulting rates.
Order-of-magnitude estimates (±30%) by design. The human baseline assumes one specialist working full-time without queueing or meetings, and excludes data and software licensing. The K-Dense figure is the credits a session consumed, valued at the Plus rate. What you are actually charged is capped per run — $9 at Standard, $29 at Pro — so the real gap is wider than shown. Full methodology.
How this research was produced
K-Dense Web planned and ran this economics investigation end to end — gathering the sources, carrying out the analysis, producing the figures, and drafting the report. The full session transcript, including every intermediate step, is available to view.