What this research found
An inverted Treasury yield curve is one of the most durable warning signs of a US recession, but commentators and Federal Reserve researchers disagree about which version of the curve to watch. K-Dense staged a head-to-head test of the 10-year-minus-3-month spread against the popular 10-year-minus-2-year spread, fitting the classic Estrella-Mishkin probit specification to monthly data through 1999 and then freezing the coefficients to forecast the 2000-2023 period. The short-end spread discriminated recession months slightly better, with an area under the ROC curve of 0.778 against 0.762, though a bootstrap that accounts for the clustered nature of recessions shows the gap is not statistically distinguishable from zero.
- On the common held-out window of 288 months from 2000 to 2023, the 10-year-minus-3-month spread reached an area under the ROC curve of 0.778 versus 0.762 for the 10-year-minus-2-year spread. Both are far above the 0.5 chance level.
- That ranking is not statistically decisive. A moving-block bootstrap with 12-month blocks put the short-end spread ahead in 76% of resamples but returned a bootstrap standard error of about 0.033, a 95% confidence interval of -0.046 to 0.083, and a two-sided p-value of roughly 0.62.
- Better in-sample fit did not mean better forecasts. The 10-year-minus-2-year model attained the higher McFadden pseudo R-squared of 0.342 against 0.266, yet lost the out-of-sample comparison; its advantage reflects a shorter 1976-onward sample that excludes the volatile 1959-1975 period.
- In both models a flatter curve raises modeled recession risk with the expected sign. A one-percentage-point fall in the spread lifts the probit index by 0.744 for the short-end measure and 1.296 for the 2-year measure, each significant at the 1% level.
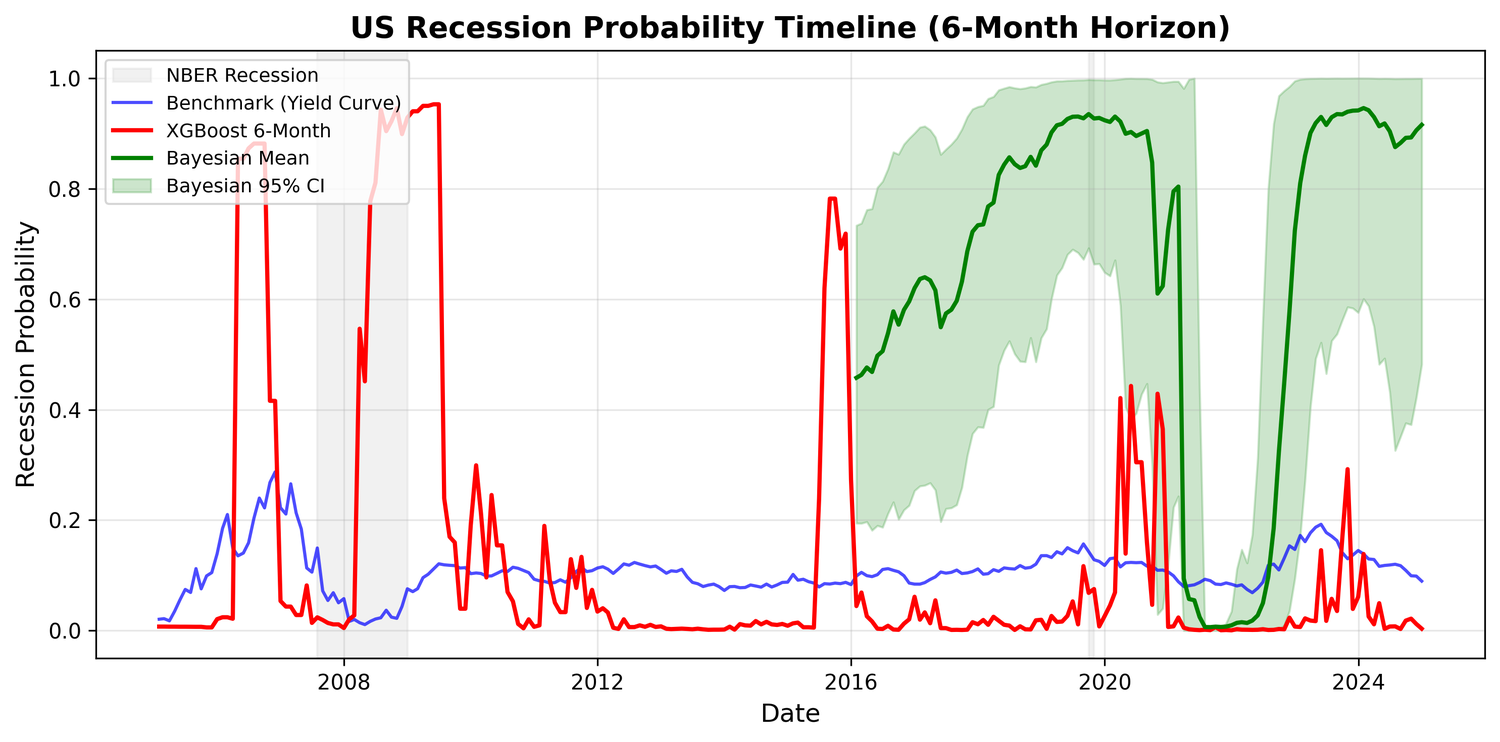
- The two models read December 2023 very differently. With spreads of -1.22 and -0.44 percentage points, they implied a 66.8% versus a 32.9% probability of recession by December 2024. No recession began in 2024, so both point signals were false positives at that horizon.
- Neither model anticipated the February-April 2020 downturn, which was triggered by a public-health shock rather than the monetary and financial dynamics the yield curve summarizes.
How it was done
Monthly series were downloaded programmatically from the Federal Reserve Economic Data repository: the 10-year and 2-year Treasury constant-maturity yields, the 3-month bill rate, and the National Bureau of Economic Research recession indicator. The forecasting target was the recession indicator shifted twelve months back, so each month's spread predicts recession status a year later. Each spread entered a univariate probit model estimated by maximum likelihood over the longest window its data allowed ending in December 1999 — 492 months from 1959 for the short-end spread, 283 months from 1976 for the 2-year spread. Those coefficients were then frozen and used to generate predicted probabilities across 2000 to 2023, compared by area under the ROC curve, with the difference tested by a moving-block bootstrap of roughly 5,000 resamples to respect the serial dependence created by overlapping labeling windows.
Data sources
- Federal Reserve Economic Data — GS10, TB3MS, GS2 constant-maturity Treasury yields and the NBER-based USREC recession indicator, monthly 1959-01 to 2023-12
- Estrella & Mishkin, Review of Economics and Statistics 80:45 (1998) — the probit specification replicated here
- Estrella & Hardouvelis, Journal of Finance 46:555 (1991)
- Engstrom & Sharpe, Federal Reserve FEDS 2018-055 — the case for short-end-anchored spreads
- Bauer & Mertens, Federal Reserve Bank of San Francisco Economic Letter 2018-07
- Wright, Federal Reserve FEDS 2006-07 — adding the policy-rate level to the probit
Limitations
The evaluation uses the latest data vintage rather than what was knowable at each historical date, so it overstates real-time information, particularly since recession dates are announced with long lags. Recession months cluster into a handful of contiguous episodes, meaning the effective number of independent events is far smaller than the 28 positive months suggest, and coefficients frozen at 1999 values cannot capture the compression of term premia that followed 2008.
How this research was produced
K-Dense Web planned and ran this economics investigation end to end — gathering the sources, carrying out the analysis, producing the figures, and drafting the report. The full session transcript, including every intermediate step, is available to view.