What this research found
Researchers have proposed spraying sea salt into the low cloud deck off Chile and Peru to cool a patch of ocean that helps seed El Niño, in the hope of blunting a developing super event. K-Dense tested that proposal against satellite and reanalysis records from 1979 to 2026, established when and how strongly the patch drives the central Pacific, sized the fleet needed, and mapped who else would feel the effect. The patch does lead the Niño 3.4 index by about two months, and roughly four spray vessels could deliver the required forcing — but the same statistics tie the patch to seven distant populated regions, so the briefing lands on a verdict of premature to reckless.
- The target patch is genuinely upstream of El Niño. Its sea-surface temperature correlates with the Niño 3.4 index at r = 0.43 contemporaneously, peaking at r = 0.46 when the patch leads by two months, and the link survives an autocorrelation correction that cut 570 raw months to an effective sample of about 45 (p < 0.005). Regression gives about 0.81 degrees C of Niño 3.4 change per 1 degree C of patch change.
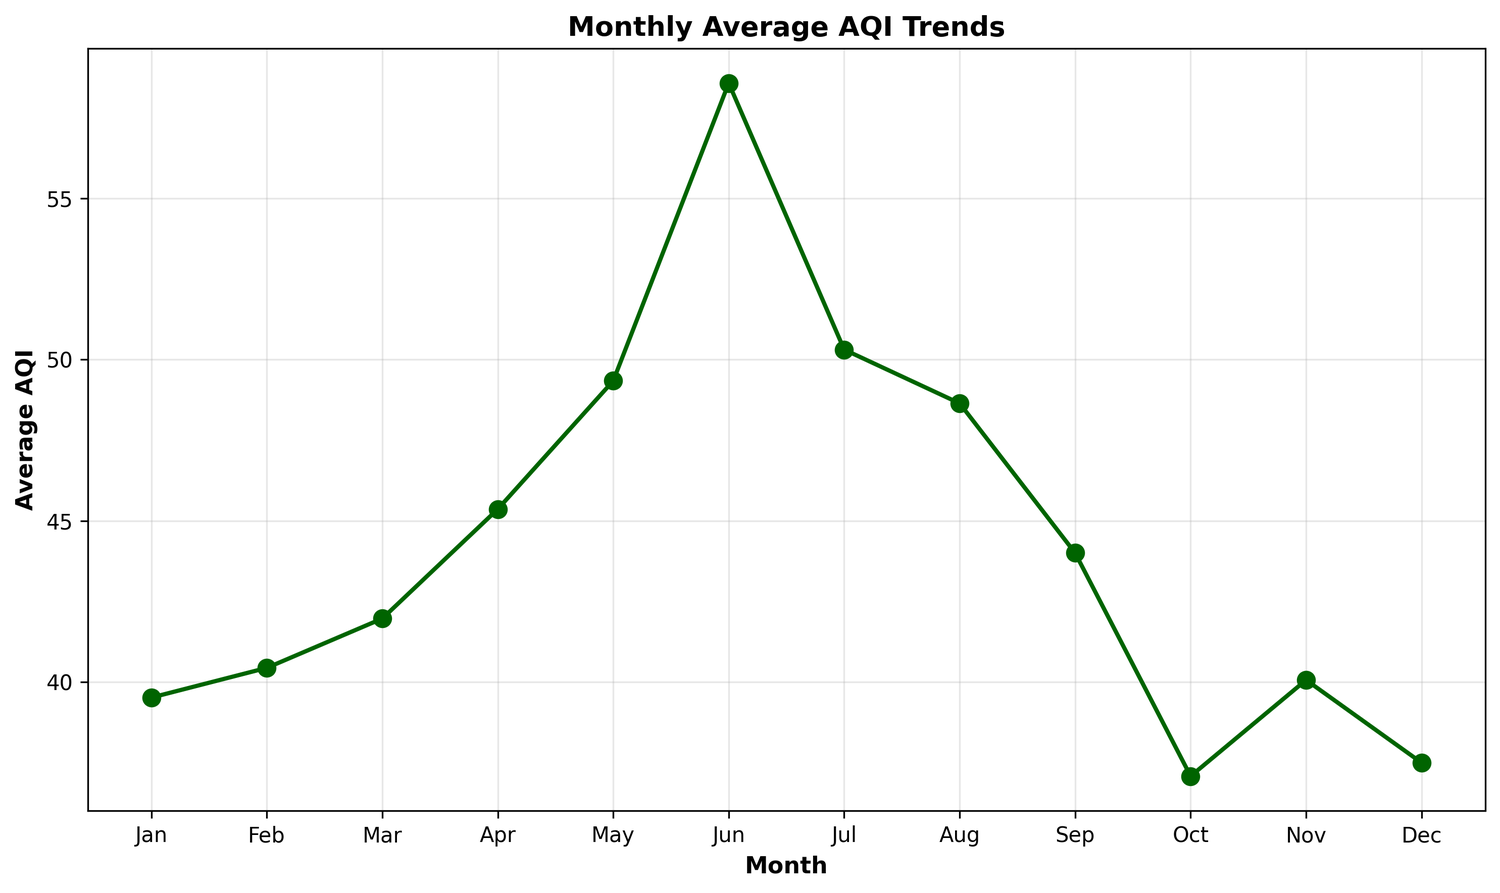
- The operational window is August to November. Patch sea-surface temperature bottoms out in September near 19.2 degrees C while low-cloud cover peaks in October near 6.2 oktas, roughly 77% sky coverage, and that overlap coincides with the growth phase of a developing event rather than its December peak.
- The hardware is not the obstacle. Imposing an extra 2 W per square meter over the 4.6 million square kilometer box needs a 12.1% rise in cloud-droplet number, delivered by roughly four automated vessels dispersing 712 metric tons of dry sea salt per day — about 90,000 metric tons over a four-month campaign. Across the full 1 to 4 W per square meter range the requirement spans 2 to 9 vessels.
- Seven distant regions are statistically tied to the patch after false-discovery-rate control. Per 1 degree C of patch warming, rainfall shifts by -0.63 mm/day over the Maritime Continent, -0.49 over the Amazon, -0.43 over northeast Brazil, -0.28 over eastern Australia and -0.23 over the Indian monsoon core, while tropical Pacific rim air temperature moves +0.31 degrees C.
- The dominant uncertainty sits in the cloud physics rather than the engineering: the fleet estimate swings by a factor of several as aerosol activation efficiency and particle lifetime vary, and the response of real stratocumulus to sustained salt injection is the single largest unknown in the chain.
- The four-dimension assessment rates science and ethics premature but side effects and governance reckless, treating the latter two as outright deployment blockers, because no treaty, consent mechanism, liability regime or independent monitor exists for deliberate regional sea-surface-temperature modification.
How it was done
Monthly satellite-era records from 1979 to 2026 were assembled into two indices: an area-weighted average over the Southeast Tropical Pacific target box at 10 to 30 degrees S and 80 to 100 degrees W, and the Niño 3.4 index over 5 degrees N to 5 degrees S and 170 to 120 degrees W, both expressed as anomalies from the 1991 to 2020 climatology. Driving strength was measured by lead-lag correlation and regression using an autocorrelation-adjusted effective sample size, and exposure was found by correlating the patch index against global precipitation and air-temperature fields under Benjamini-Hochberg false-discovery-rate control to guard against testing thousands of grid points at once. A separate parameterized engineering model combined the Twomey cloud-albedo relationship with a steady-state sea-salt budget for the marine boundary layer to convert a target radiative forcing into droplet-number increase, daily salt mass, seawater volume and fleet size. The findings were scored across scientific readiness, socio-ecological risk, governance and ethics in a decision matrix.
Data sources
- ERSST version 5 monthly sea-surface temperature, 1979–2026 (Huang et al., 2017)
- GPCP monthly precipitation (Adler et al., 2003, 2018)
- NOAA GlobalTemp land and ocean air temperature (Huang et al., 2020)
- ICOADS cloudiness records
- Feingold et al., Science Advances 10:12 (2024) — research needed to evaluate marine cloud brightening viability and risks
- Twomey, Atmospheric Environment 8:1251 (1974) — cloud albedo response to added condensation nuclei
- Latham et al., Philosophical Transactions of the Royal Society A 370:4217 (2012) — marine cloud brightening engineering concept
Limitations
The efficacy case rests on observational correlation rather than experiment: a lagged, significant relationship shows the patch precedes El Niño but cannot show that artificially cooling it would produce a proportional reduction in an event, and the side-effect estimates are likewise correlational. This is a rapid, non-peer-reviewed briefing built on observational statistics and a parameterized engineering model, not a substitute for coupled Earth-system-model efficacy studies.
How this research was produced
K-Dense Web planned and ran this environment investigation end to end — gathering the sources, carrying out the analysis, producing the figures, and drafting the report. The full session transcript, including every intermediate step, is available to view.