What this research found
Written against a second-quarter 2026 stress premise — Brent crude at $114, the Strait of Hormuz partially blockaded, and the US 30-year Treasury yield through 5% — this 18-page policy memo asks how much inflation an oil shock of that size would actually deliver. Every major oil shock since 1973 was pulled from public data, and a vector autoregression was fitted to project US headline consumer price inflation under sustained Brent paths of $110, $130, and $150. The central case lands closer to 2022 than to 1979.
- Twelve-month cumulative CPI from a March 2026 anchor comes in at +3.45% under $110 Brent, +3.89% under $130, and +4.27% under $150. The extreme path adds only 0.82 percentage points over the mild one.
- The historical comparator matters more than the price level. The central case resembles 2022, which delivered +4.8% twelve-month CPI, rather than 1979 at +12.0%, a difference the memo attributes to regime-anchored inflation expectations and a falling energy share of the consumer basket.
- Forecast uncertainty dwarfs the scenario spread. The $110 path alone spans +2.18% to +4.78% between its 10th and 90th percentiles — far wider than the 0.82-point gap separating the mildest and severest Brent assumptions.
- Emerging-market exposure is concentrated rather than general. On a seven-metric composite scaled from 0 to 100, EMEA scores 100, broad emerging markets 56, Latin America 44, and Asia 0.
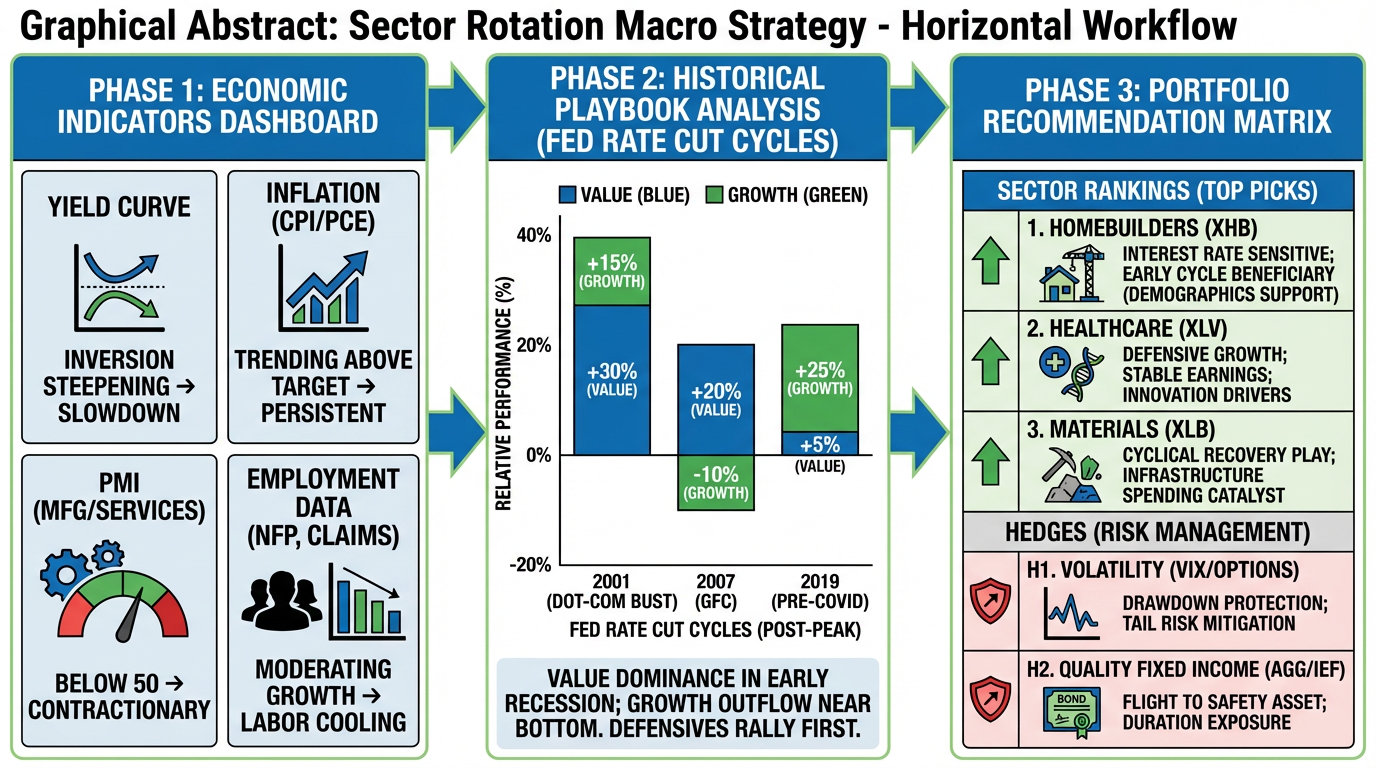
- Sector exposure splits cleanly along the demand, cost, and yield channels. Airlines, trucking, chemicals, autos, and utilities carry the most negative net exposure; energy exploration and production companies and the integrated majors carry the most positive.
How it was done
A monthly panel of 13 macro series — Brent and WTI crude, the 30-year Treasury yield, headline CPI, dollar indices, and credit and emerging-market spreads — was assembled from FRED covering January 1970 through May 2026, 677 months in all. Oil shocks were identified programmatically using a rolling 60-month z-score on three-month log returns with a 25% move floor, clustered into episodes, then checked against the narrative dating in Hamilton and Kilian. A Cholesky-identified first-order vector autoregression on Brent, the long yield, the dollar, and CPI was estimated over 464 months from June 1987 to March 2026, with all four series stationary at the 5% level by augmented Dickey-Fuller test. Brent and yields were pinned to each scenario path while the dollar and CPI propagated through the residual covariance, with 2,000-draw Monte Carlo bands, and emerging-market vulnerability was scored by rank-blending seven metrics into a single composite.
Data sources
- FRED — 13 monthly macro series, January 1970 to May 2026 (677 months), including Brent crude, headline CPI, the 30-year Treasury yield, and the Baa-to-10-year credit spread
- ICE BofA emerging-market corporate option-adjusted spread indices for Latin America, Asia, EMEA, and broad EM (history from May 2023 onward)
- US Treasury Fiscal Data, used for cross-reference
- Hamilton (1983, 2003) and Kilian (2009) for narrative validation of shock dating
- 27 verified citations across the oil-to-inflation, emerging-market spread, and Federal Reserve reaction-function literatures
Limitations
The projection model is linear, so it cannot capture the non-linear response a full closure of the Strait of Hormuz would likely produce. The regional emerging-market spread series are only available from May 2023 onward, leaving the geographic vulnerability composite with a short history behind it.
Figures from this analysis
What this would have cost
This session was one of 67 audited against what a qualified specialist would spend producing the same deliverable alone, at mid-market US consulting rates.
Order-of-magnitude estimates (±30%) by design. The human baseline assumes one specialist working full-time without queueing or meetings, and excludes data and software licensing. The K-Dense figure is the credits a session consumed, valued at the Plus rate. What you are actually charged is capped per run — $9 at Standard, $29 at Pro — so the real gap is wider than shown. Full methodology.
How this research was produced
K-Dense Web planned and ran this macro strategy investigation end to end — gathering the sources, carrying out the analysis, producing the figures, and drafting the report. The full session transcript, including every intermediate step, is available to view.