Today we are introducing K-Bench 01, our internal benchmark for scientific AI agents. It asks a simple question: what happens when you take the questions scientists actually send an AI agent (attachments, ambiguity, half-specified goals and all) and make nine frontier models do the work end to end?
We run a scientific agent platform, so we have an unusual dataset: real requests from real researchers, not benchmark questions written to be scored. Actual work: "here is my RNA-seq count matrix, find the differentially expressed genes and tell me if the batch effect is real", "read these three papers and tell me whether the effect replicates", "clean this clinical export and check whether the endpoint is even powered".
We sampled 178 of them, stripped them back to the first message plus its attachments, and handed each one to nine frontier models in identical sandboxes. Every model ran bare, in pi as the harness with nothing but its stock built-in tools: no scientific skills, no custom prompts, no sub-agents, no model-specific engineering of any kind. This is deliberate. K-Bench 01 measures what the raw model brings to the table, because that is the floor everything else gets built on. 1,602 runs, all completed. Then we had three LLM judges score every run blind against an 8-dimension rubric: 4,806 assessments in total, each judge reading the transcript and opening the actual output files (4.0 artifacts per assessment on average). One of those judges is gpt-5.6-sol, which is also a contestant, and as you will see, that conflict of interest shows up in the numbers.
(Two things K-Bench 01 is not. It is not training data; it is an evaluation set, and it is never to be trained on. And it is not public: the tasks stay internal, both because they derive from real user requests and because an unpublished test set is the only kind that stays uncontaminated. The question we care about is not which model wins; it is whether a benchmark built from real scientific work still discriminates between frontier models, and on what. This is the first edition of something we intend to keep rebuilding as the frontier moves.)
The full methodology, rubric, and complete results are written up in our pre-print, K-Bench: measuring model performance on real scientific agent requests. What follows is the short version.
Here is what we found.
1. Almost nobody clears the bar
The rubric's key line is 8 out of 10: the score at which a domain scientist would accept the work with minor edits. Not "impressive for an AI", but usable.
Exactly one of the nine models gets there, and only barely: gpt-5.6-sol averages 8.04, with a confidence interval of [7.81, 8.24] that straddles the line itself. Everything else lands below.
Hold that result loosely, though: gpt-5.6-sol is also one of the three judges, and it rates its own runs +0.83 points above where the other judges put them. Strip that thumb off the scale by asking the one judge with no model in the race, and the winner changes. Section 5 quantifies this in full.
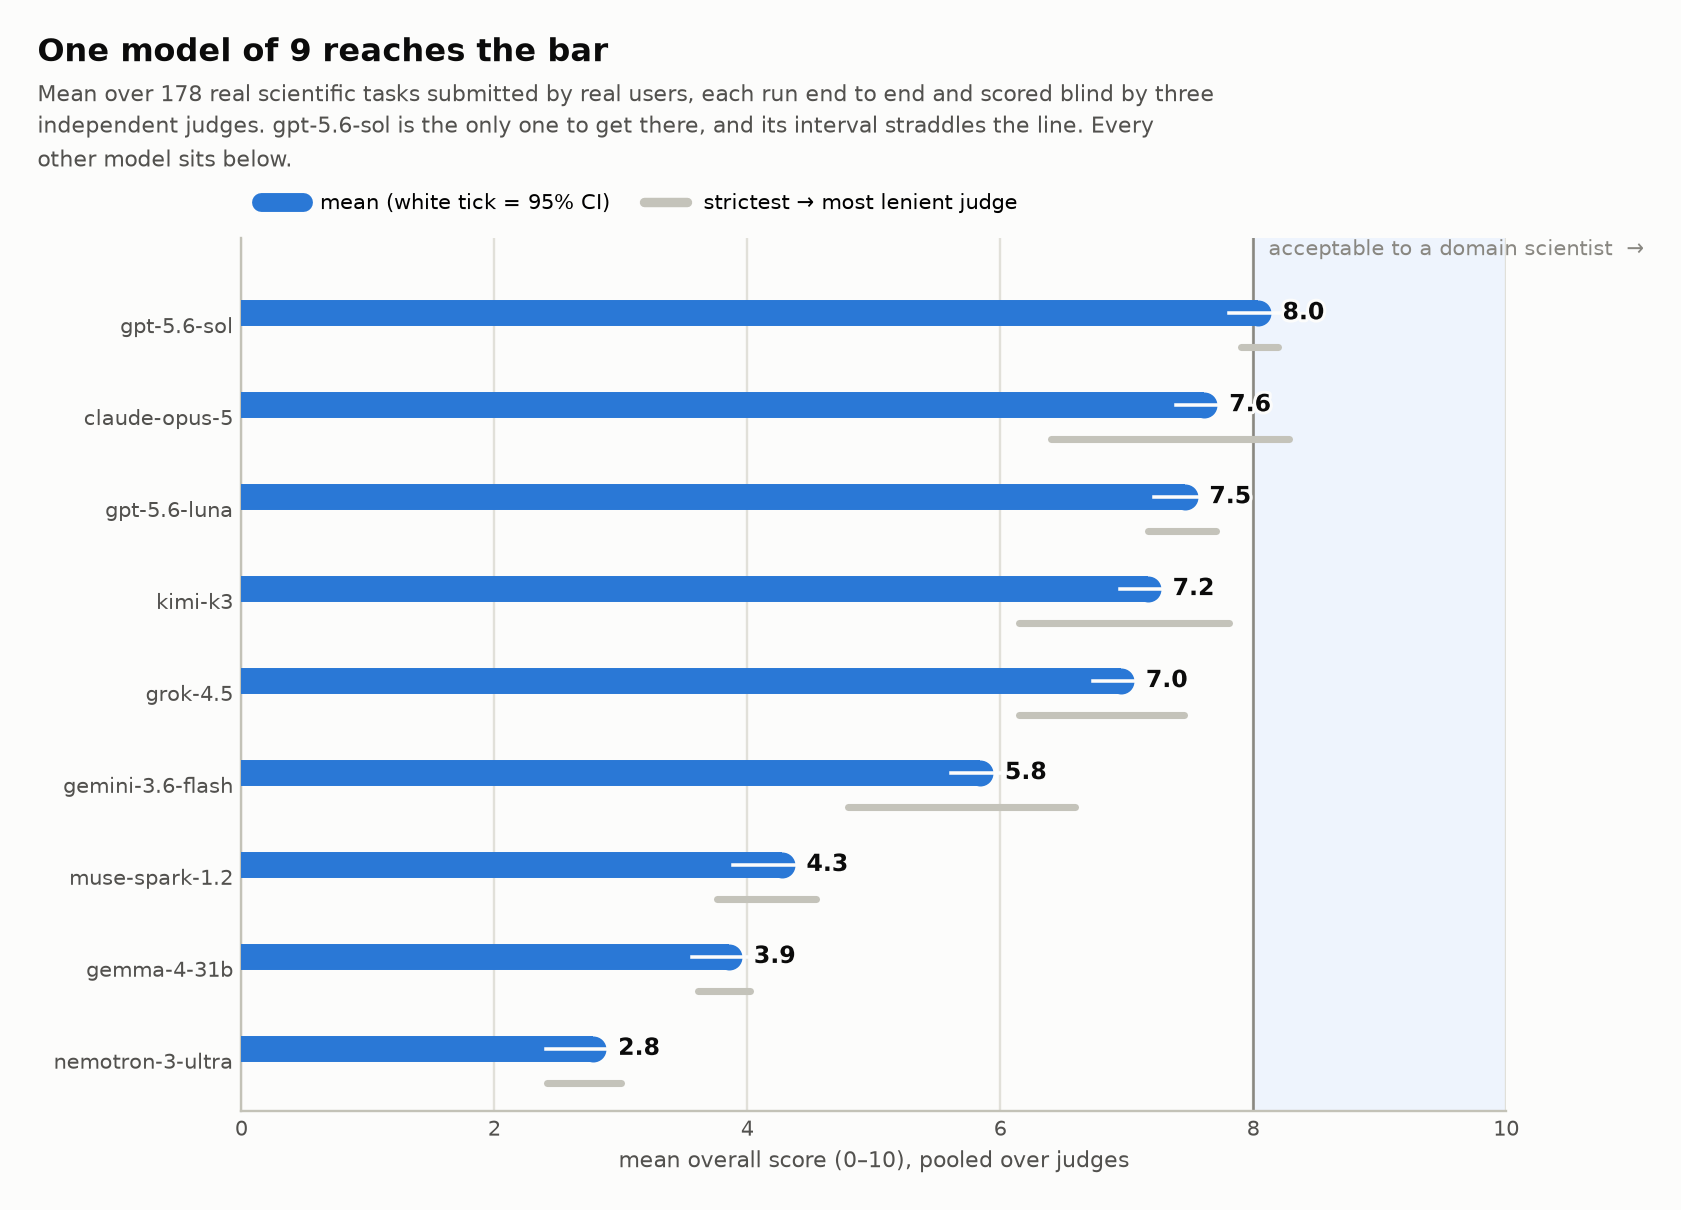
The mean is the flattering statistic, though. Underneath it:
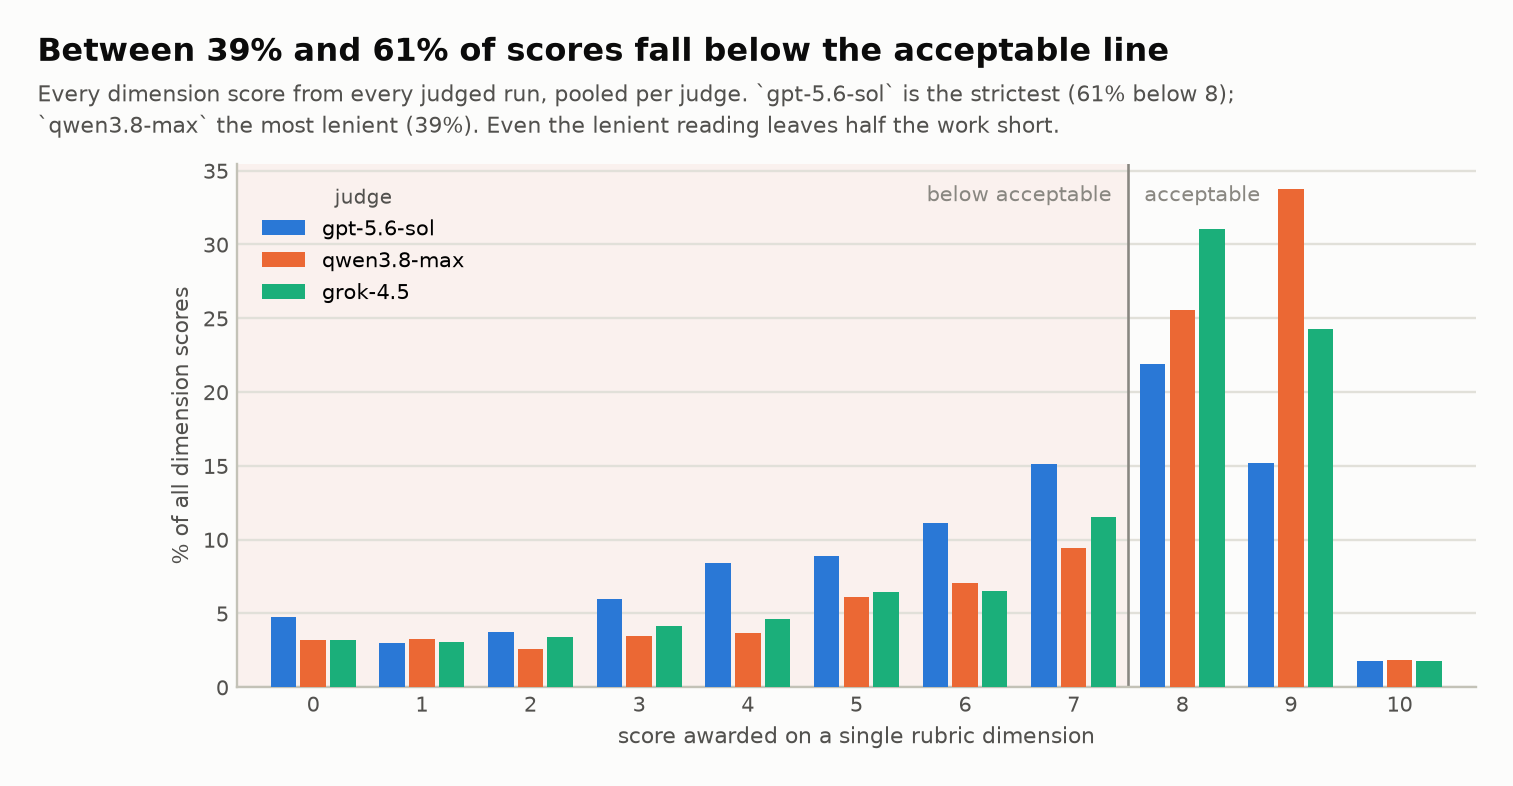
- 48% of all 39,934 individual dimension scores fall below 8. 20% fall below 5: not "needs edits", but wrong.
- 40% of runs are rated fully successful by a majority of judges; only 19% by all three unanimously. Meanwhile 46% of runs are rejected by every judge, with no disagreement at all.
- 12% of the 178 tasks were solved by no model whatsoever.
And this is the generous reading. Our three judges disagree substantially about how strict to be; their mean overall scores span 1.01 points. Take the most lenient judge and treat its opinion as truth, and 51% of runs still fall short. That is the conservative floor on how much of this dataset is unsolved.
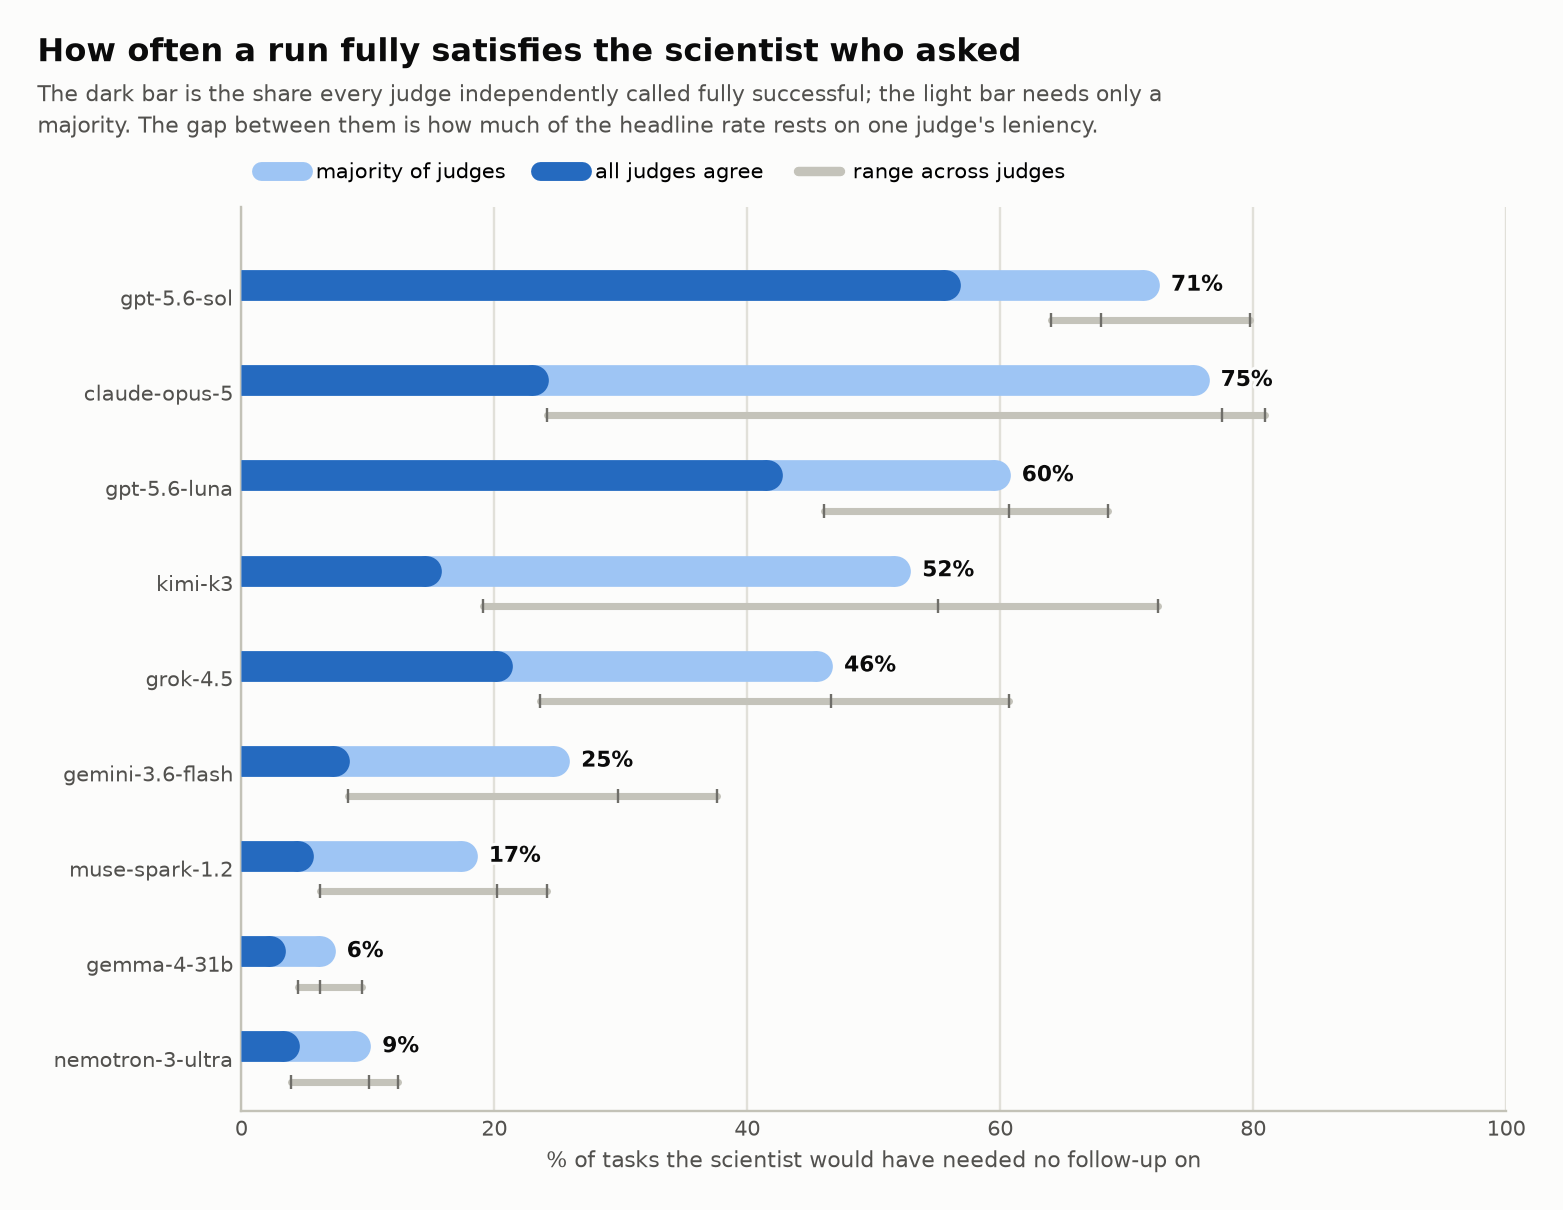
In that last chart, several models' headline "fully successful" rate is carried almost entirely by the lenient judges; the share that all three judges independently sign off on is far smaller. When you read any agent benchmark, including this one, ask which of those two numbers you are being shown.
2. Competent operators, weaker scientists
Scores are not uniformly low, and the shape of the shortfall is the most useful thing in the dataset.
Split the rubric into how the work was done and what the work is. The execution dimensions (driving the tools, structuring the answer, reasoning through the steps) average 6.9. The substance dimensions (scientific accuracy, honesty about uncertainty, quality of the artifacts produced) average 6.3.
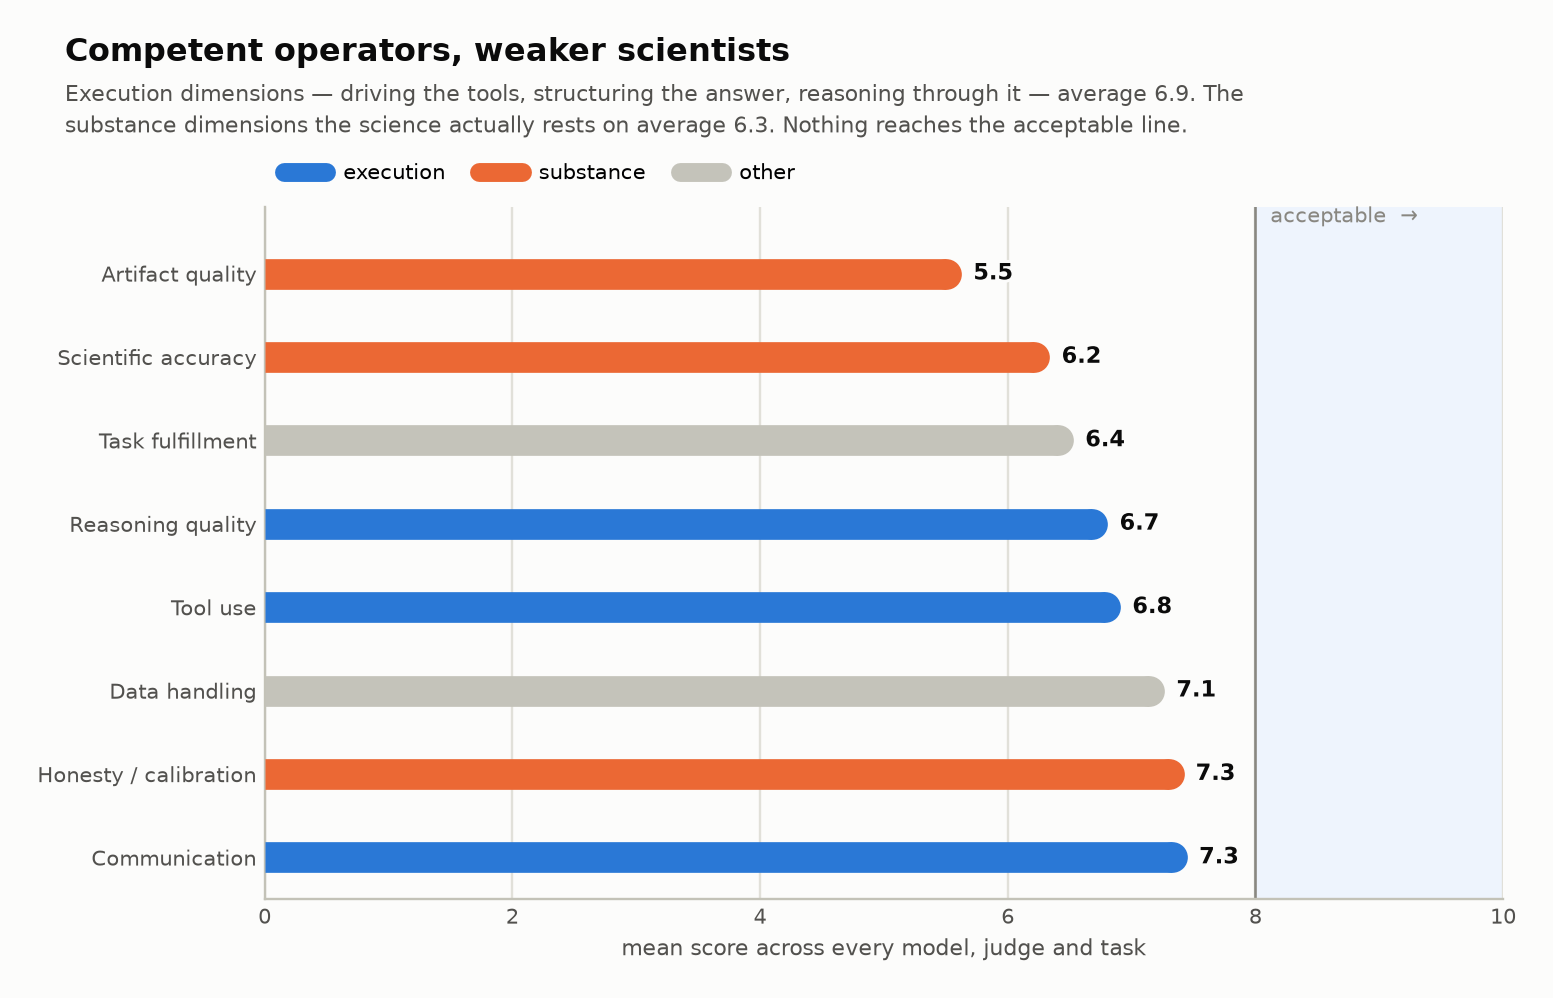
The weakest dimension in the whole set is artifact quality (5.5). The strongest is communication (7.3). These models are best at sounding like they did the work and worst at leaving behind the work.
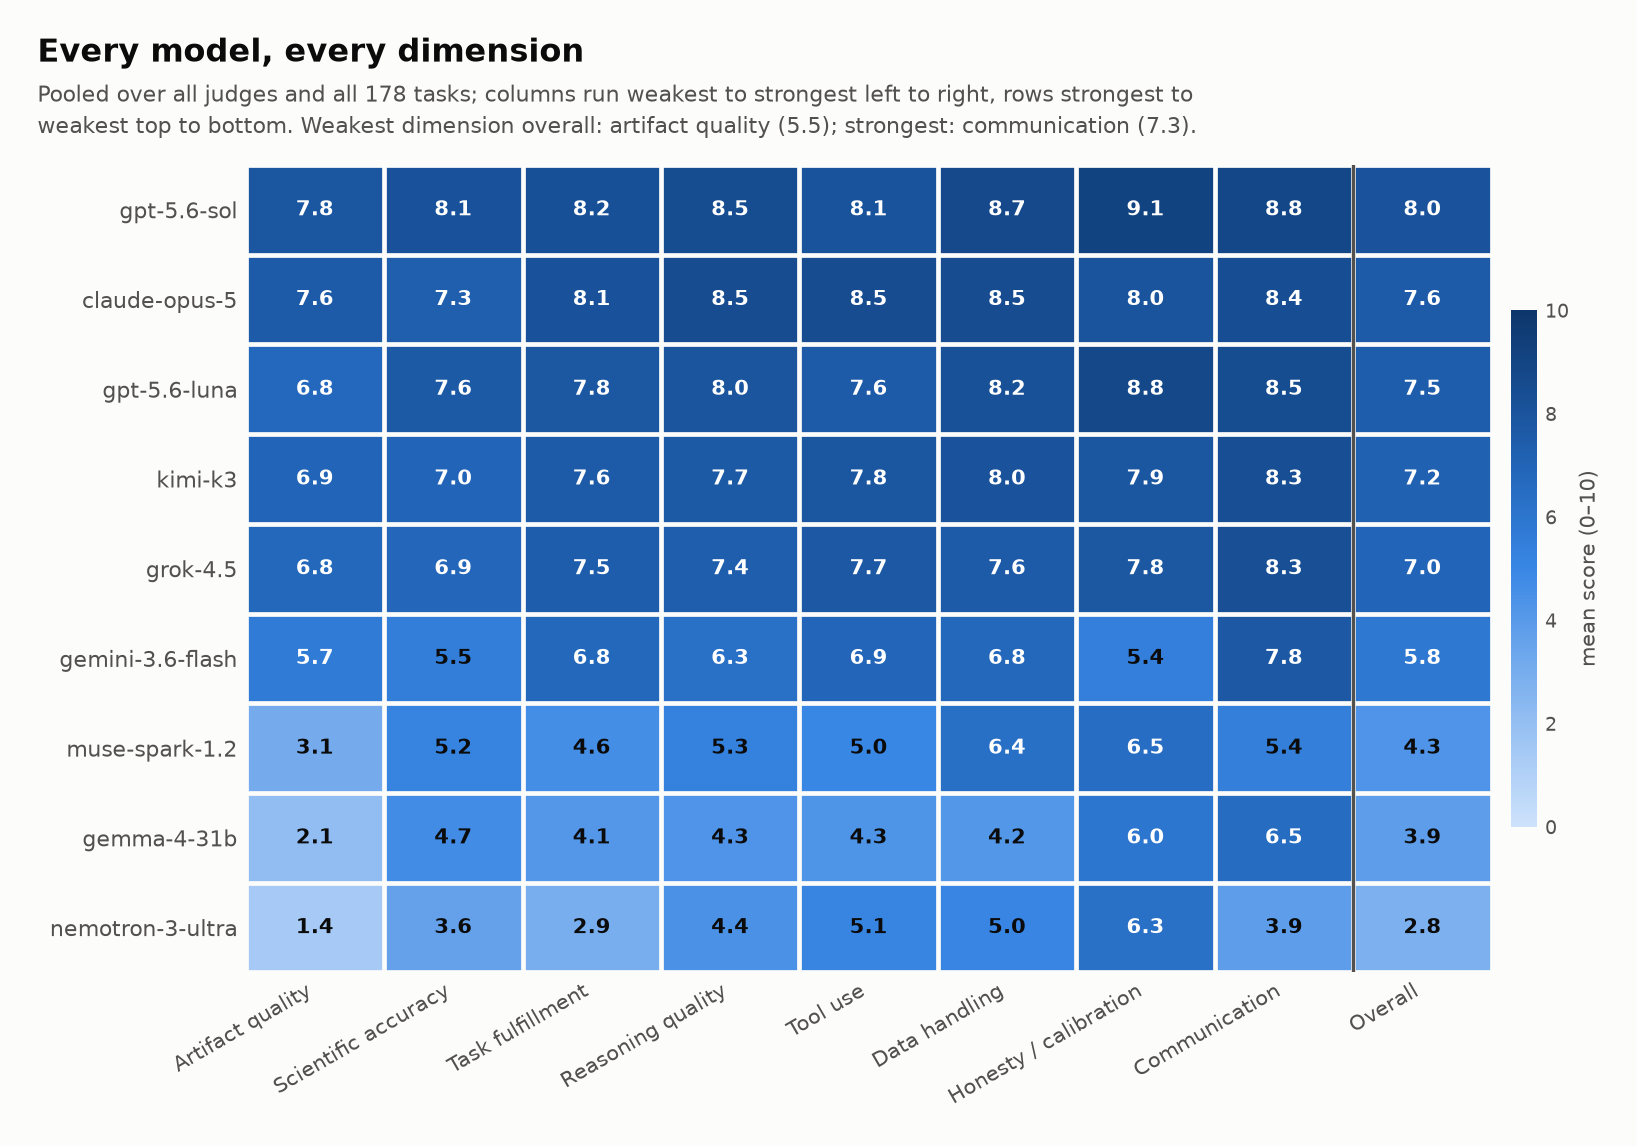
If you are post-training a model for scientific work, this is the actionable signal. A model that scores well on tool use and communication while scoring poorly on accuracy and honesty is not bottlenecked on agentic scaffolding. Better harnesses, more tools, longer context: none of it touches this. It is bottlenecked on domain judgment, and on knowing what it does not know.
3. The most common failure is overclaiming
Judges tagged every run from a closed 16-tag taxonomy. The top three: overclaiming 31%, missing_artifacts 23%, shallow_analysis 18%.
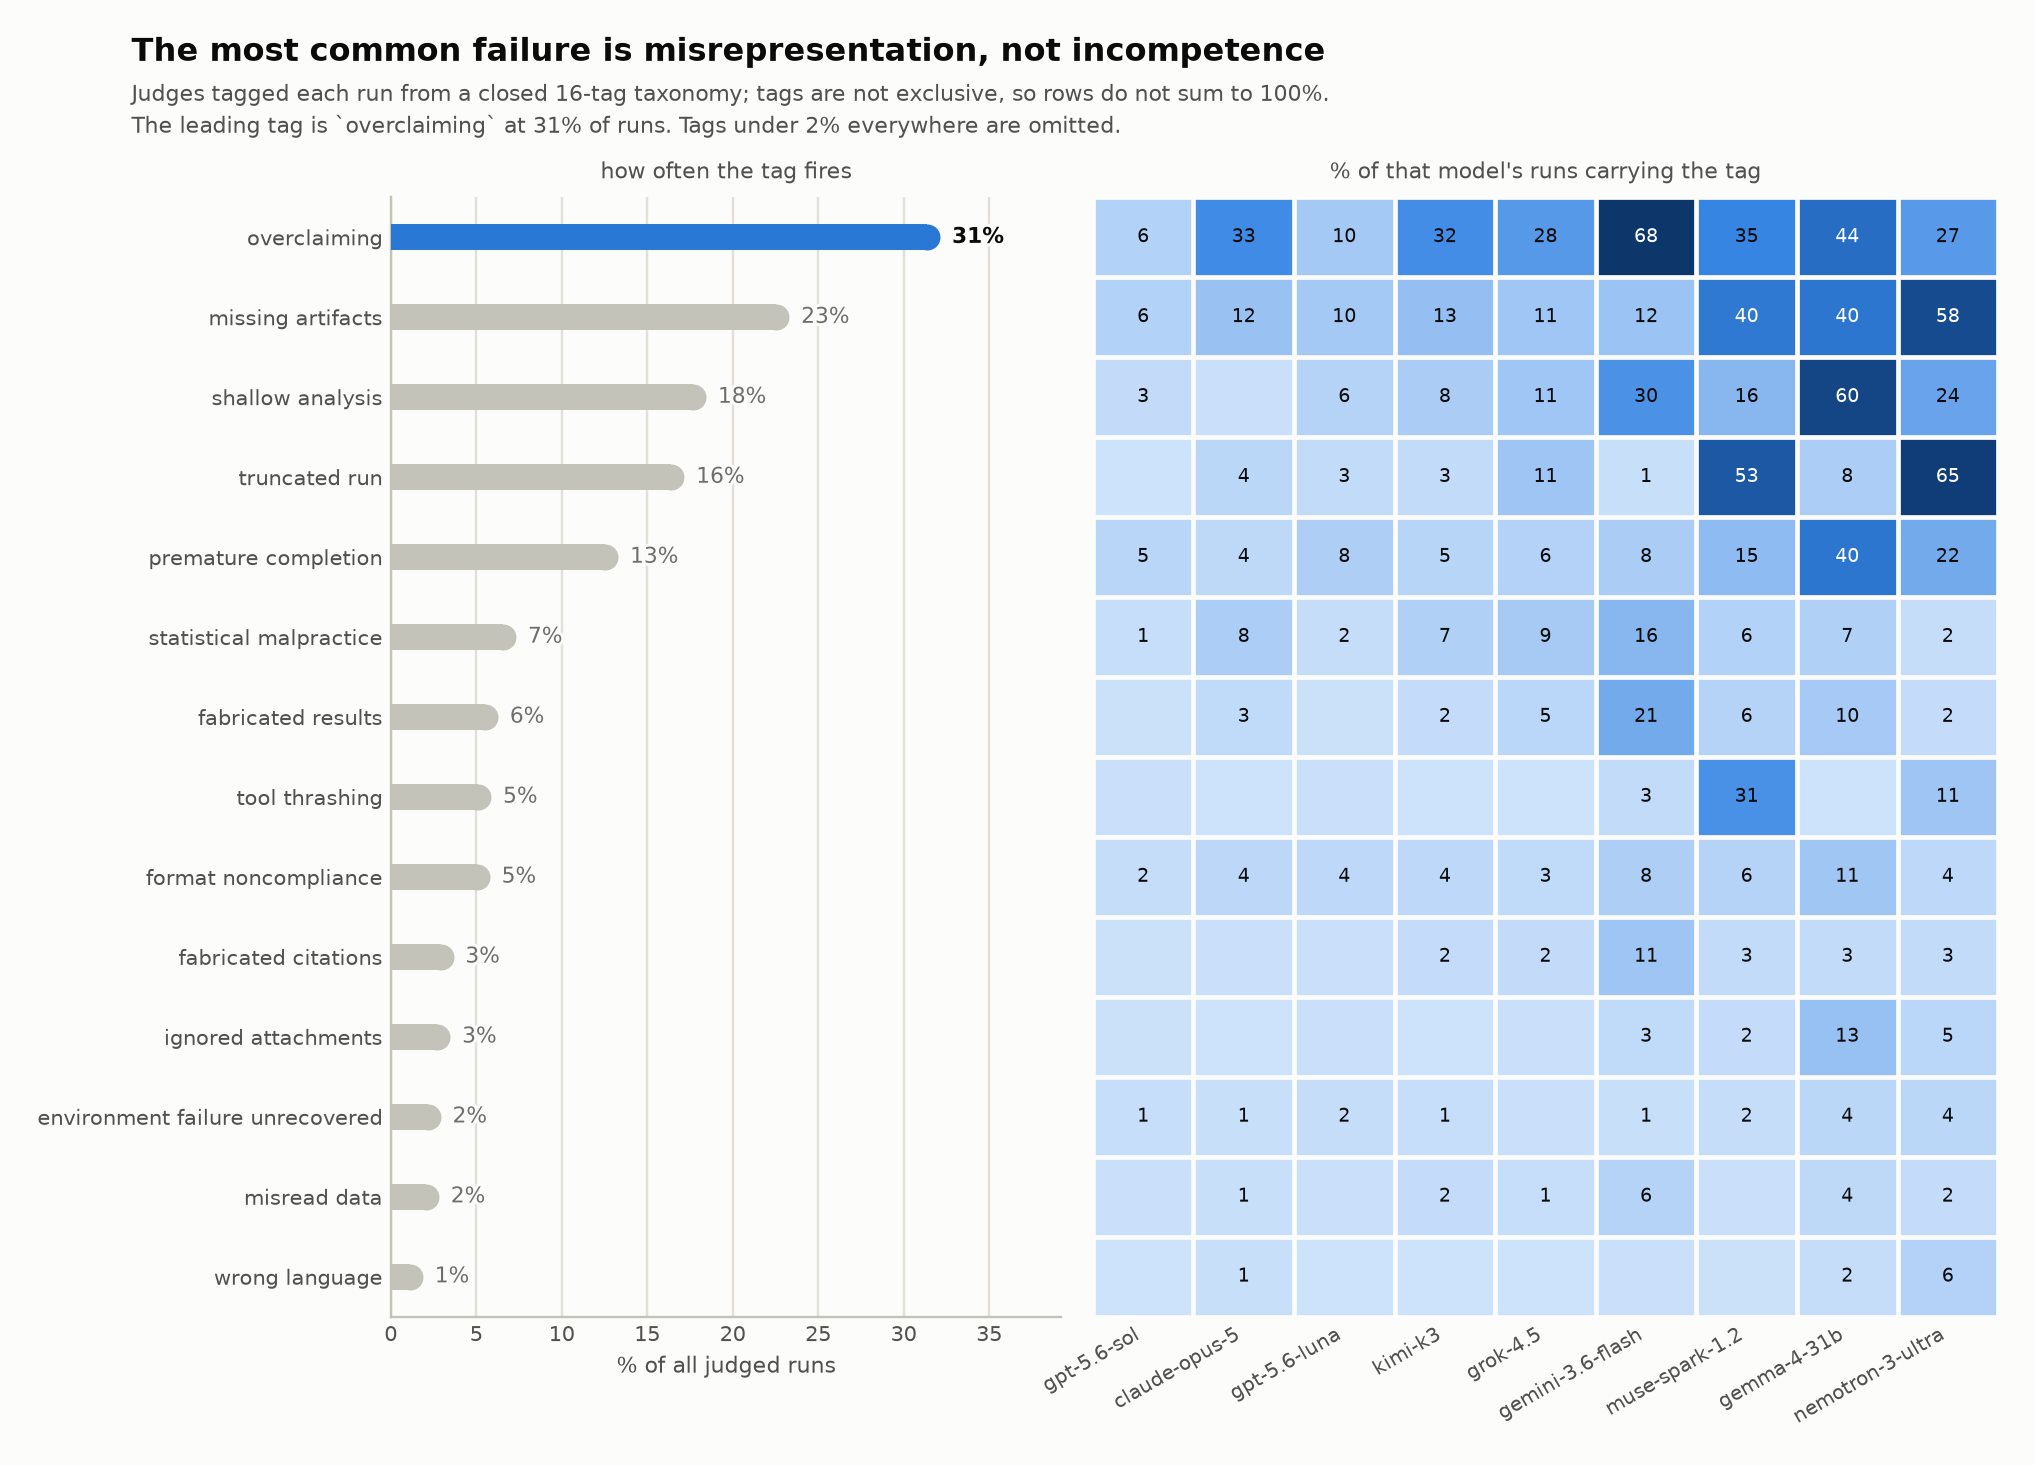
Group overclaiming with its relatives (fabricated results, fabricated citations, calling a job done that isn't) and honesty-related failures touch 40% of all runs in the benchmark.
This is a different problem from the model being weak. A weak model that says "I could not do this" costs a scientist five minutes. A capable model that produces a confident, well-formatted, plausible analysis with a fabricated citation and an overstated conclusion costs a scientist a week, or a retraction.
The spread on this tag is enormous and does not track raw capability: gemini-3.6-flash carries it on 68% of runs while gpt-5.6-sol carries it on 6%. Two models can land within a point of each other on the leaderboard and be completely different propositions to hand a graduate student.
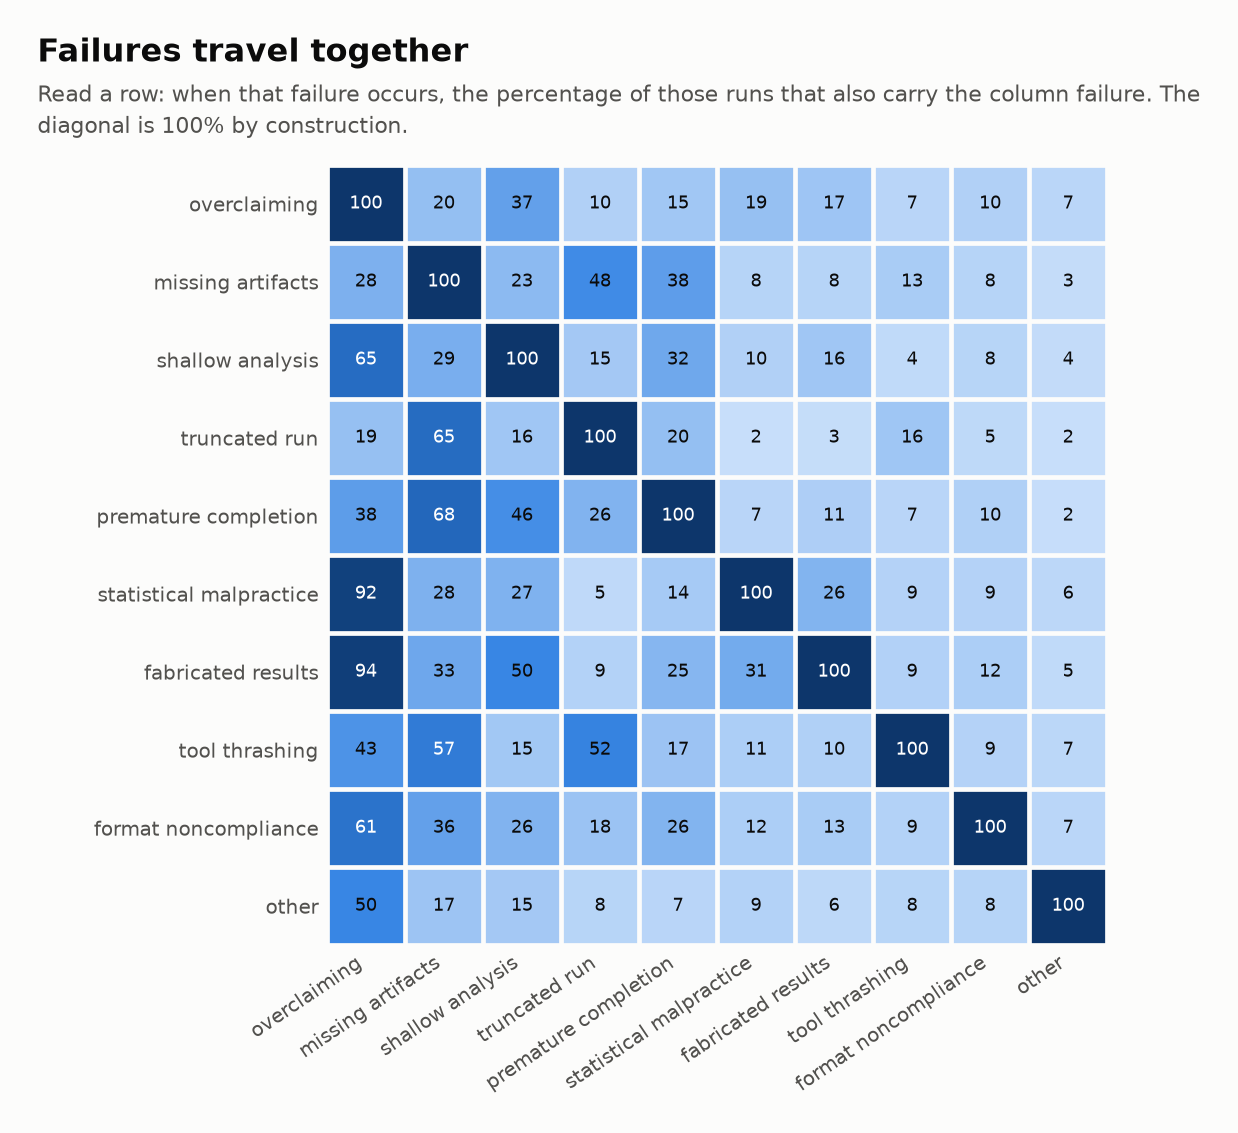
Failures also travel in packs. A run that truncates tends to also be missing artifacts; a run that overclaims tends to also be shallow. They are symptoms of the same underlying event, the model losing the thread and papering over it, rather than independent defects.
4. What the models actually do
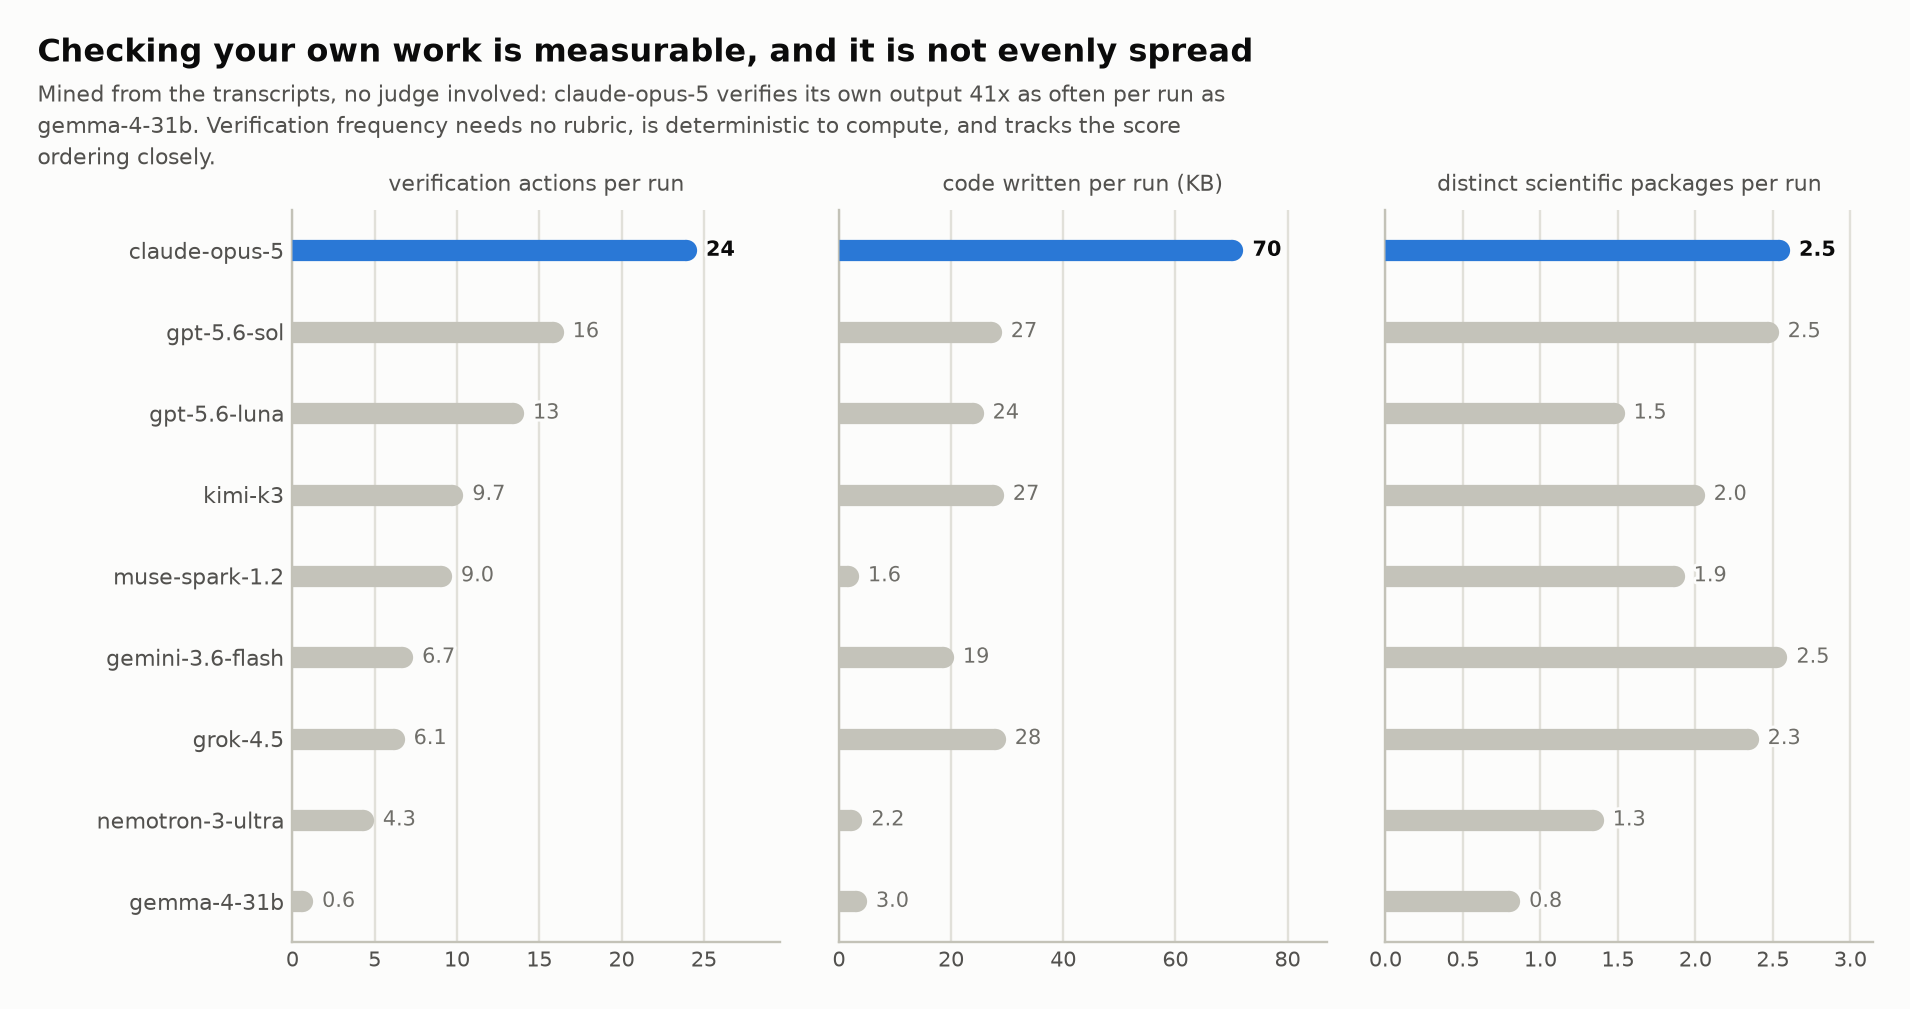
Scores are judgments. This section is measurement, mined from the transcripts with no judge involved.
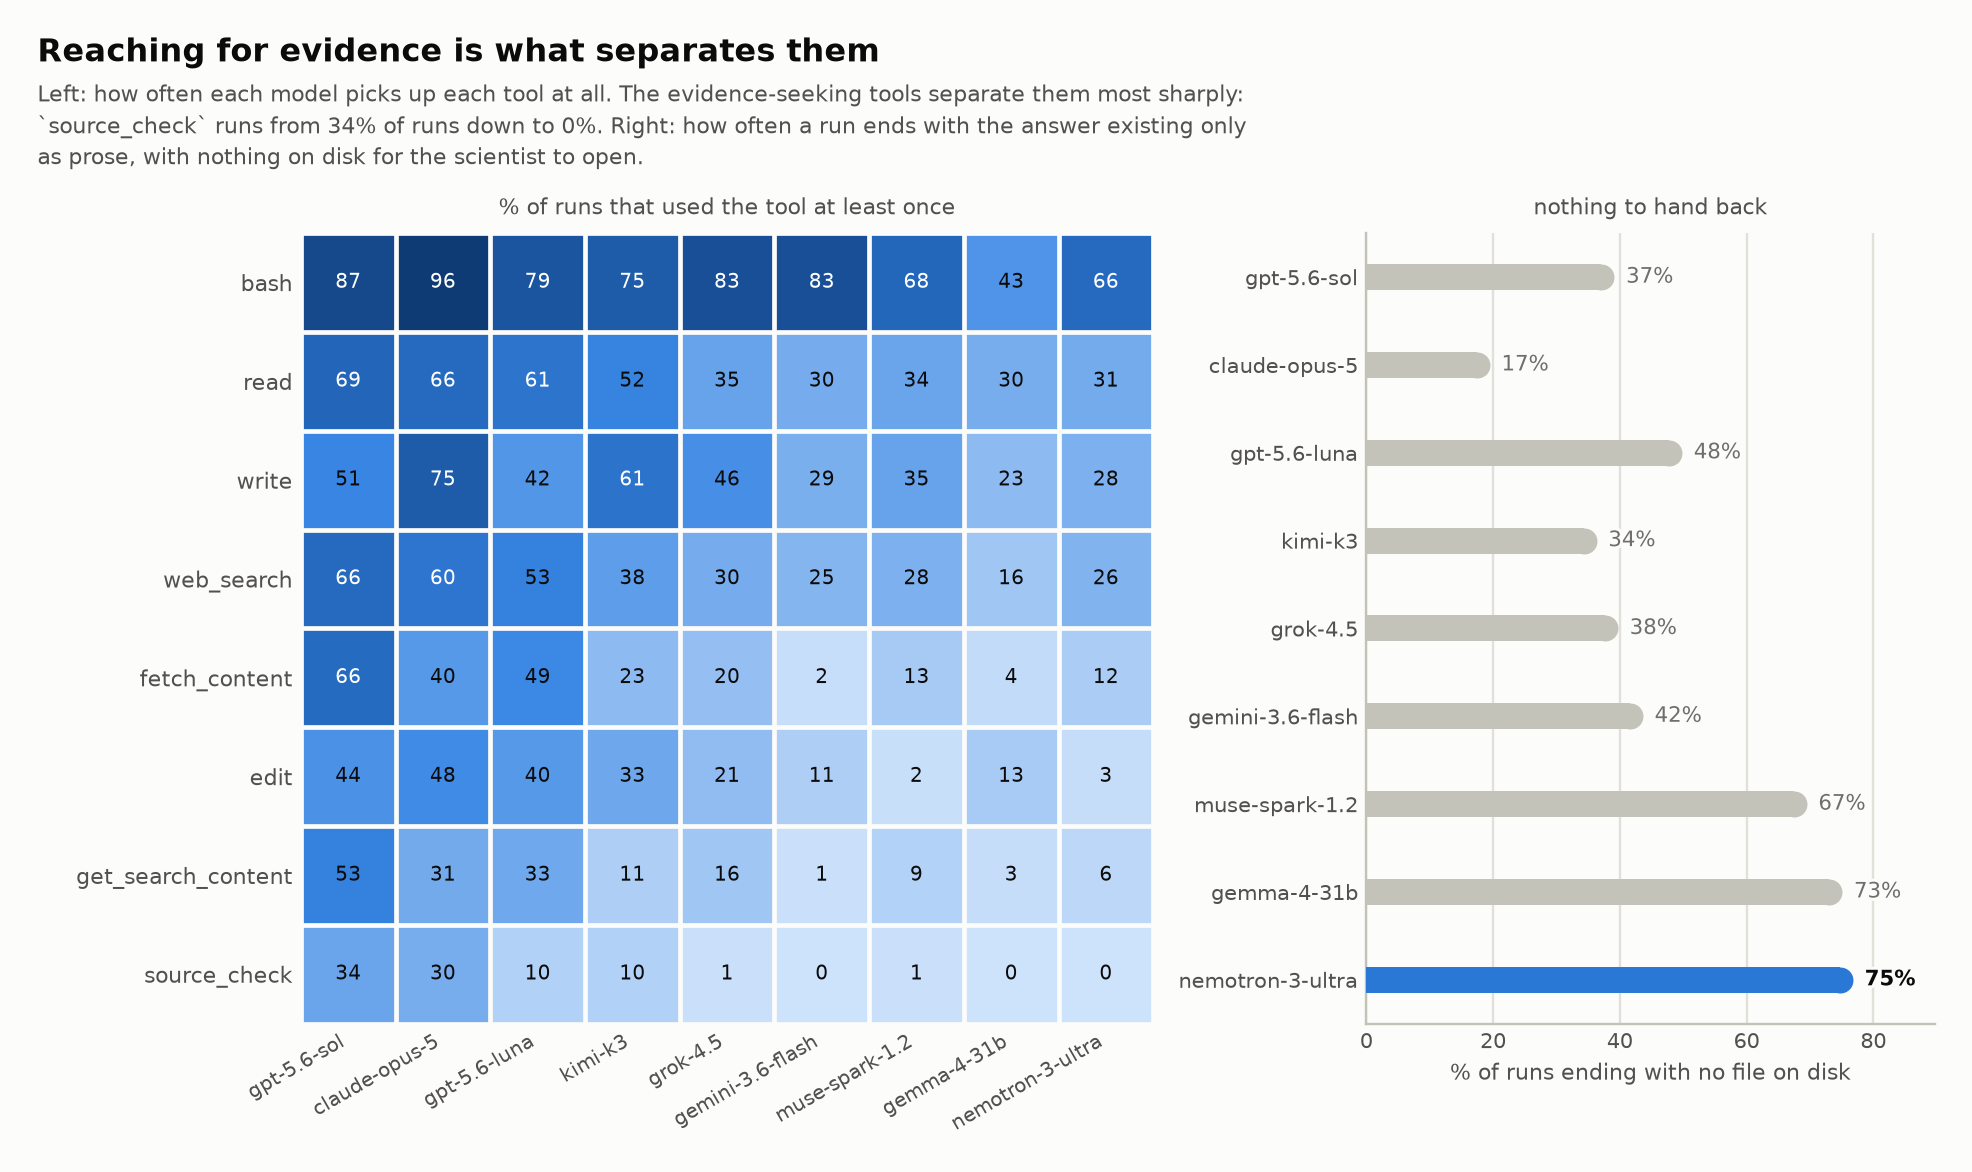
The tools that separate the models most sharply are the evidence-seeking ones. Look at source_check: 34% of runs for the model that uses it most, and 0% for the model that uses it least. Same for fetching a page and reading it. A model that never fetches and never checks a source is structurally incapable of grounding a scientific claim; that is a mechanism for the accuracy gap in section 2, not merely a correlate of it.
Then there is the plainest measure of all: did the run leave anything behind? claude-opus-5 ends 17% of runs with no file on disk. nemotron-3-ultra-550b-a55b ends 75% that way: three runs in four produce nothing but prose. A scientist asked for a figure, a table, a cleaned dataset. Eloquence is not a deliverable.
The cleanest example needs no judge at all. Count the times a run checks its own output: re-reads a file it wrote, re-runs a computation, asserts on a result. claude-opus-5 does this 24 times per run; gemma-4-31b-it does it 0.6 times, a 41x gap. Verification frequency is cheap, deterministic, and it tracks the score ordering closely. If you want one number to watch while post-training an agent for science, it is a better candidate than anything a rubric produces.
5. Why a single leaderboard number is the wrong summary
Everything above depends on how strict a judge is. There is one comparison that does not: take two models on the same task, scored by the same judge, and ask which won. Judge calibration cancels. Task difficulty cancels. There are 534 such paired comparisons behind every cell below.
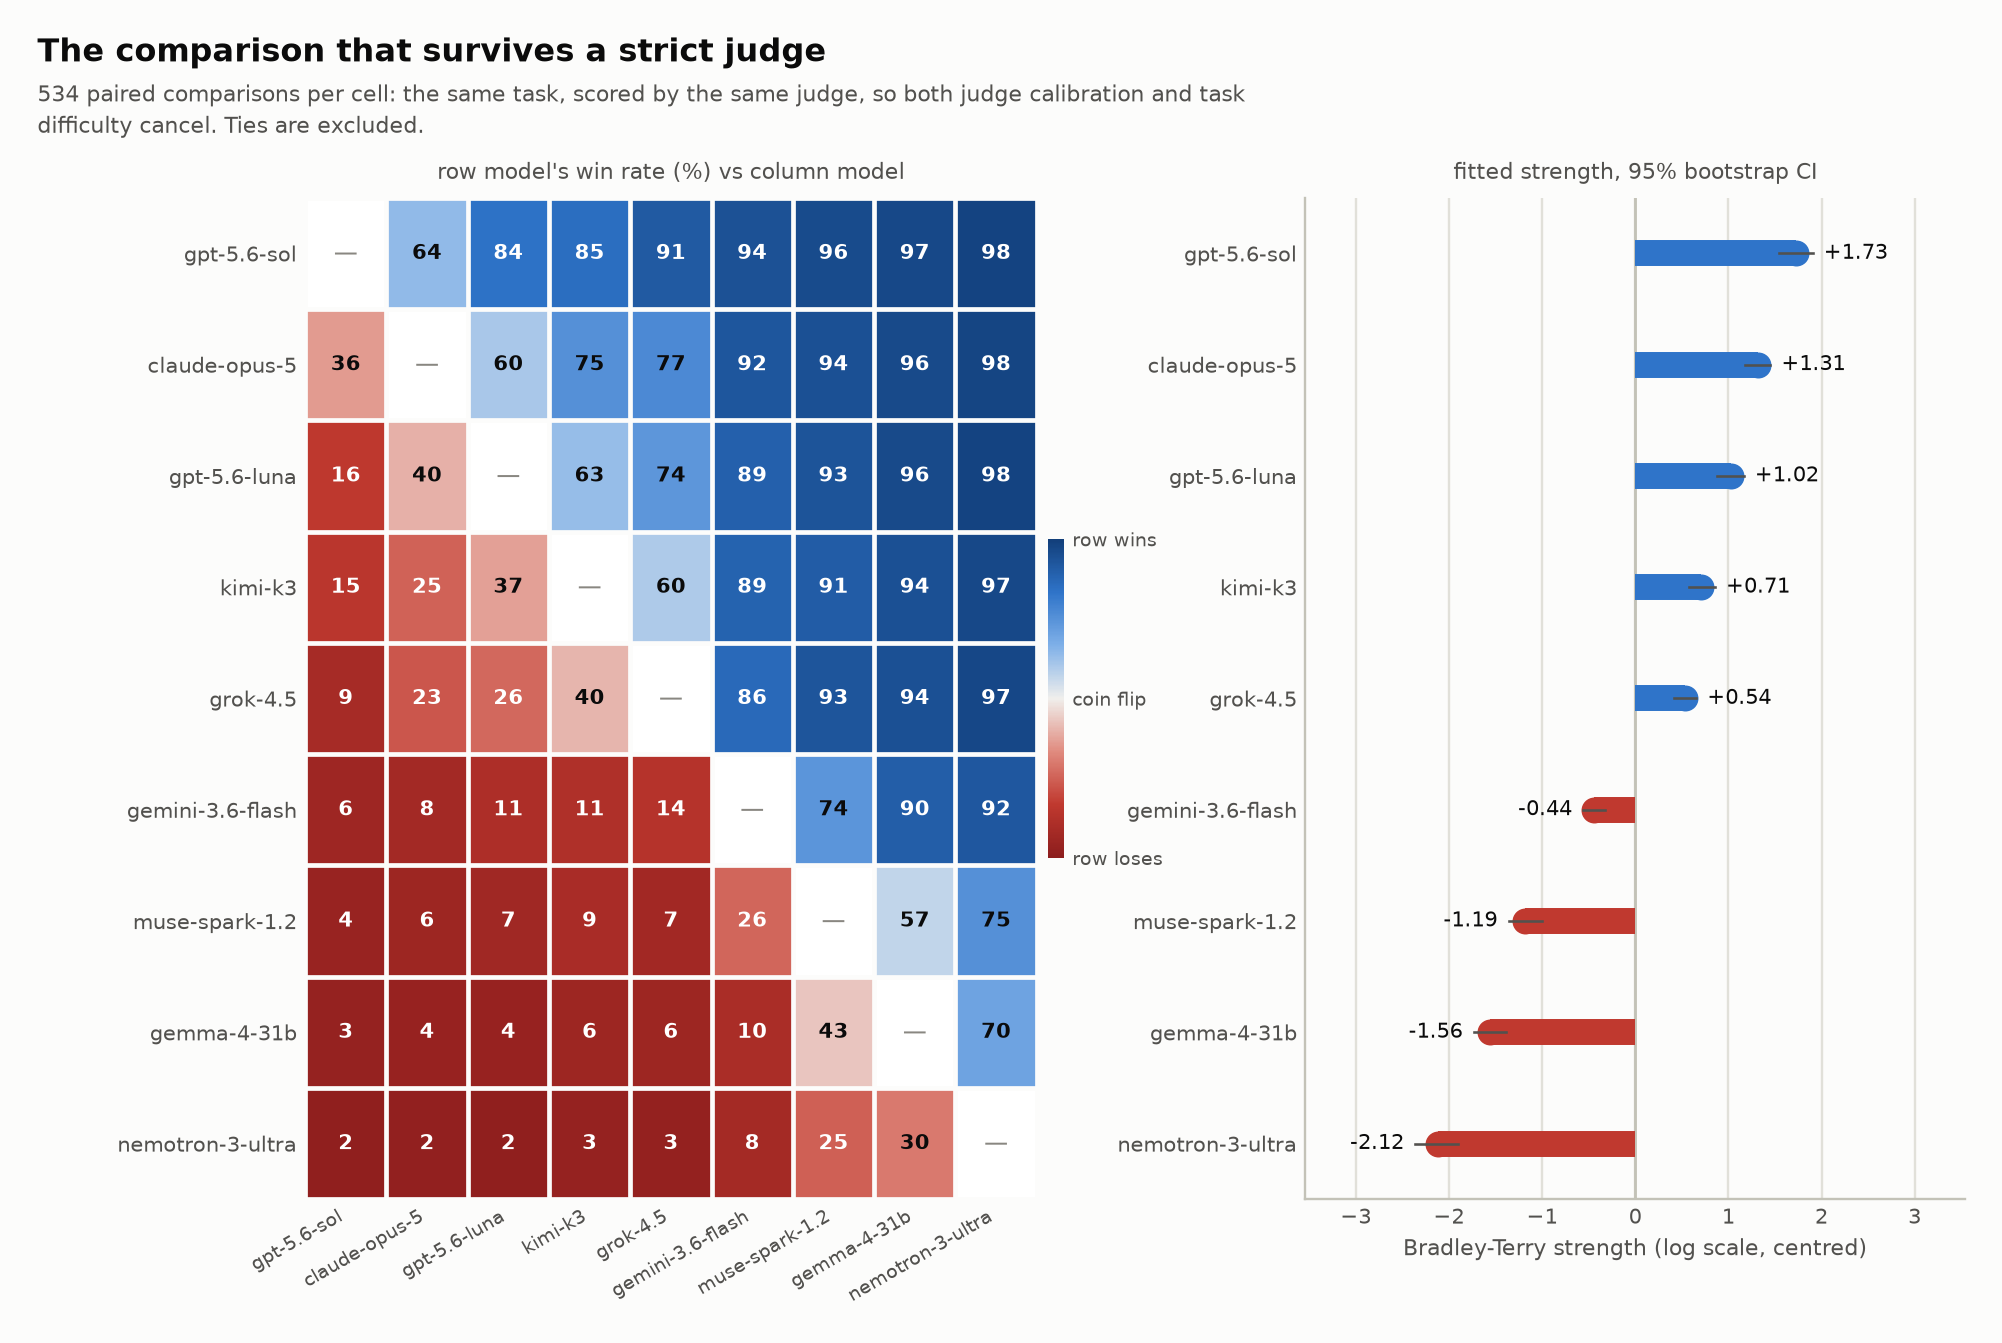
Pairing separates models that the pooled means cannot.
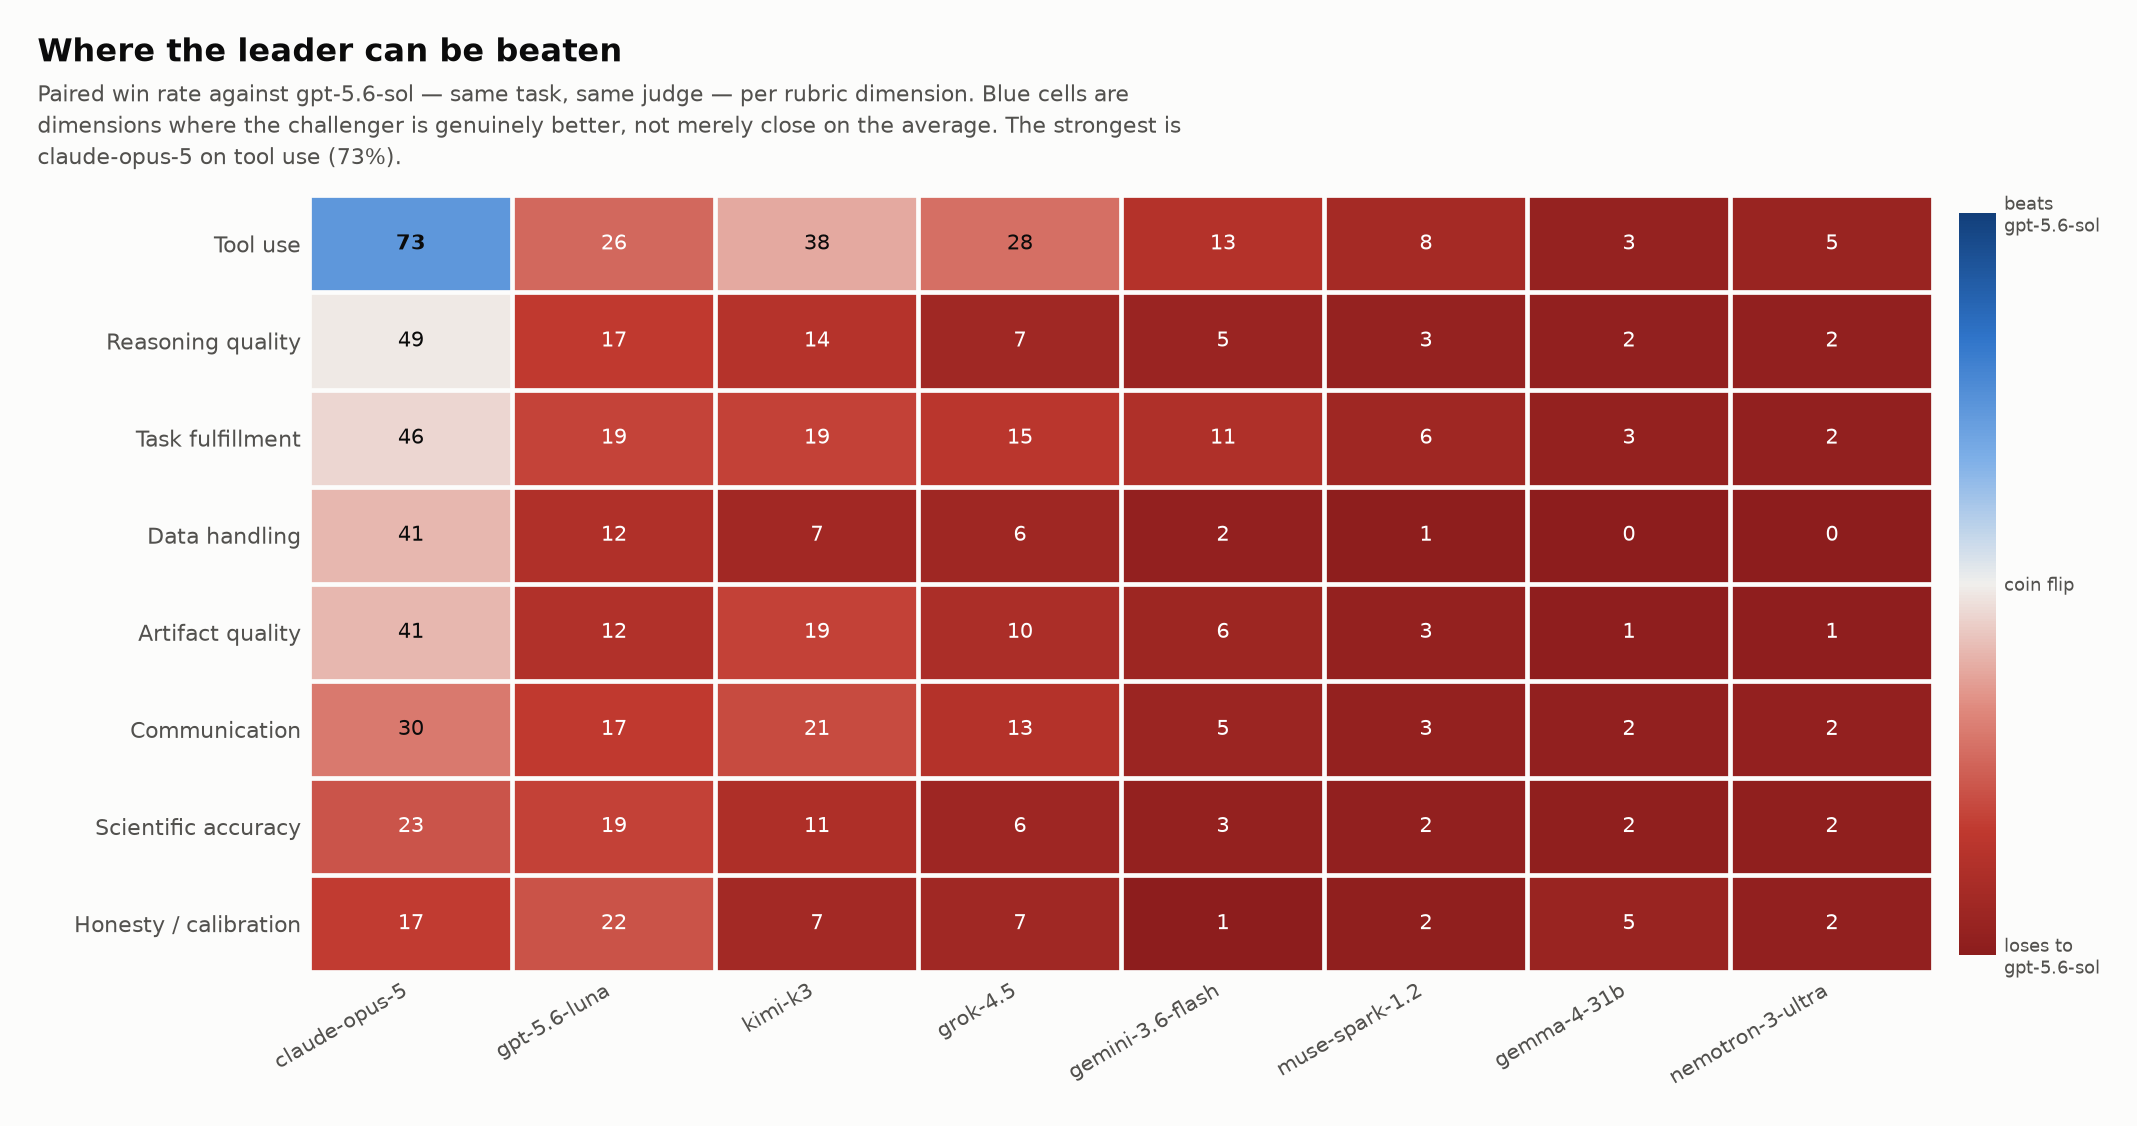
claude-opus-5 loses to gpt-5.6-sol overall, and beats it on tool use in 73% of paired matchups. The top two models are not the same kind of good. One is a better engineer; the other is a more careful scientist. Averaging them into a single column and sorting descending destroys exactly the information you would use to pick one.
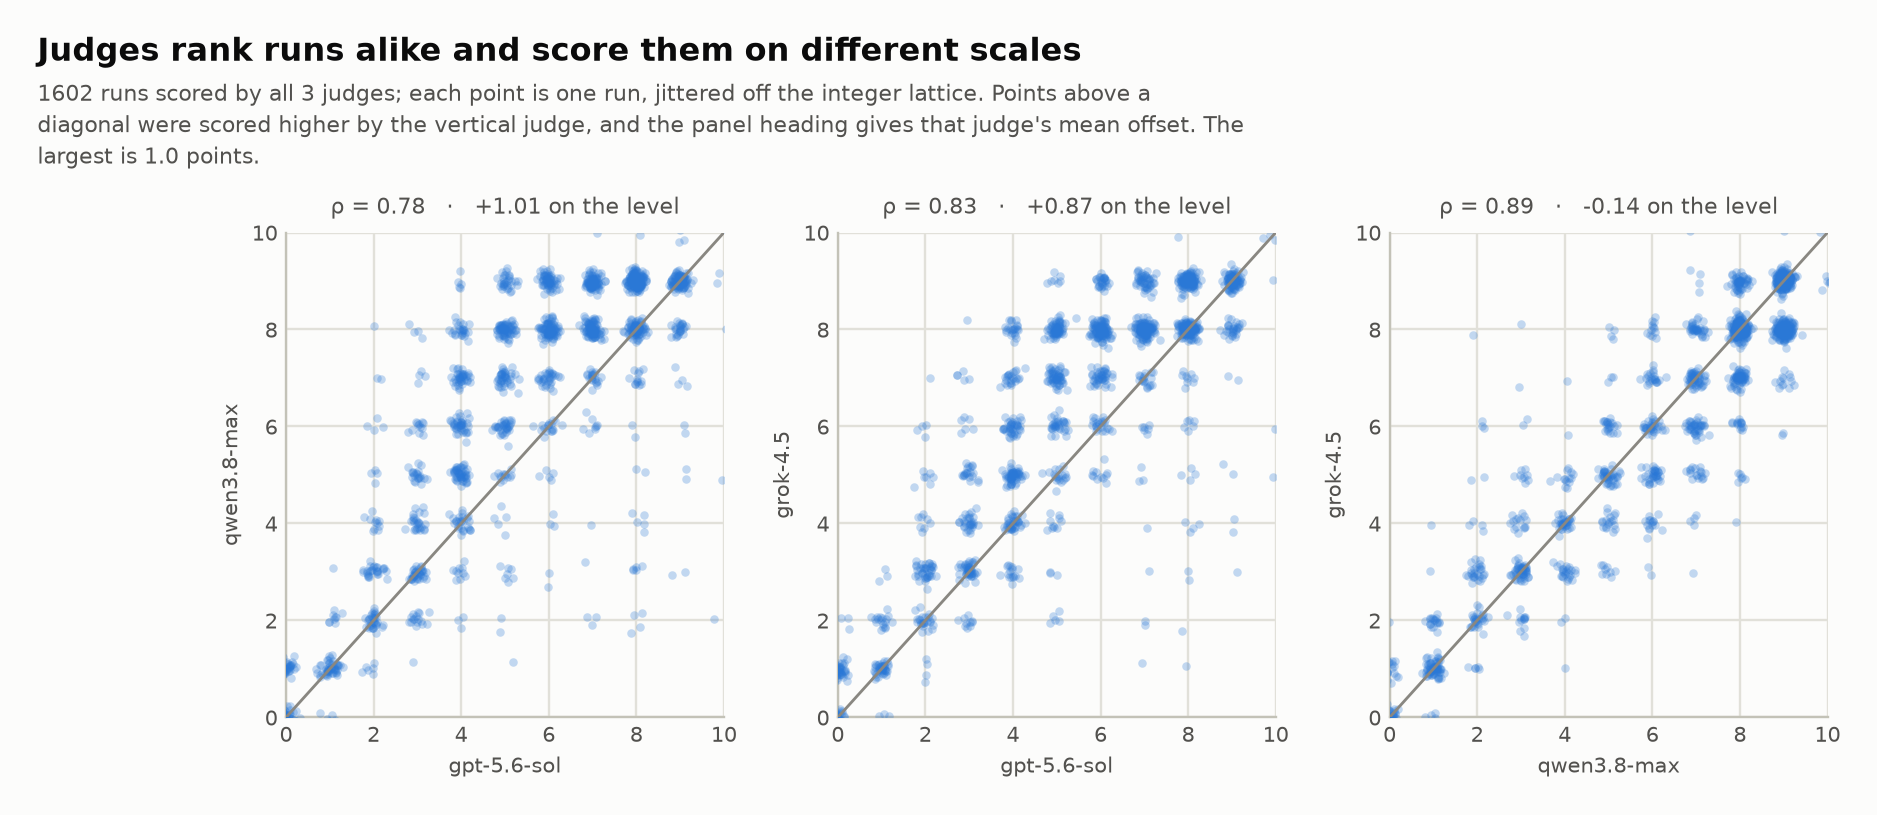
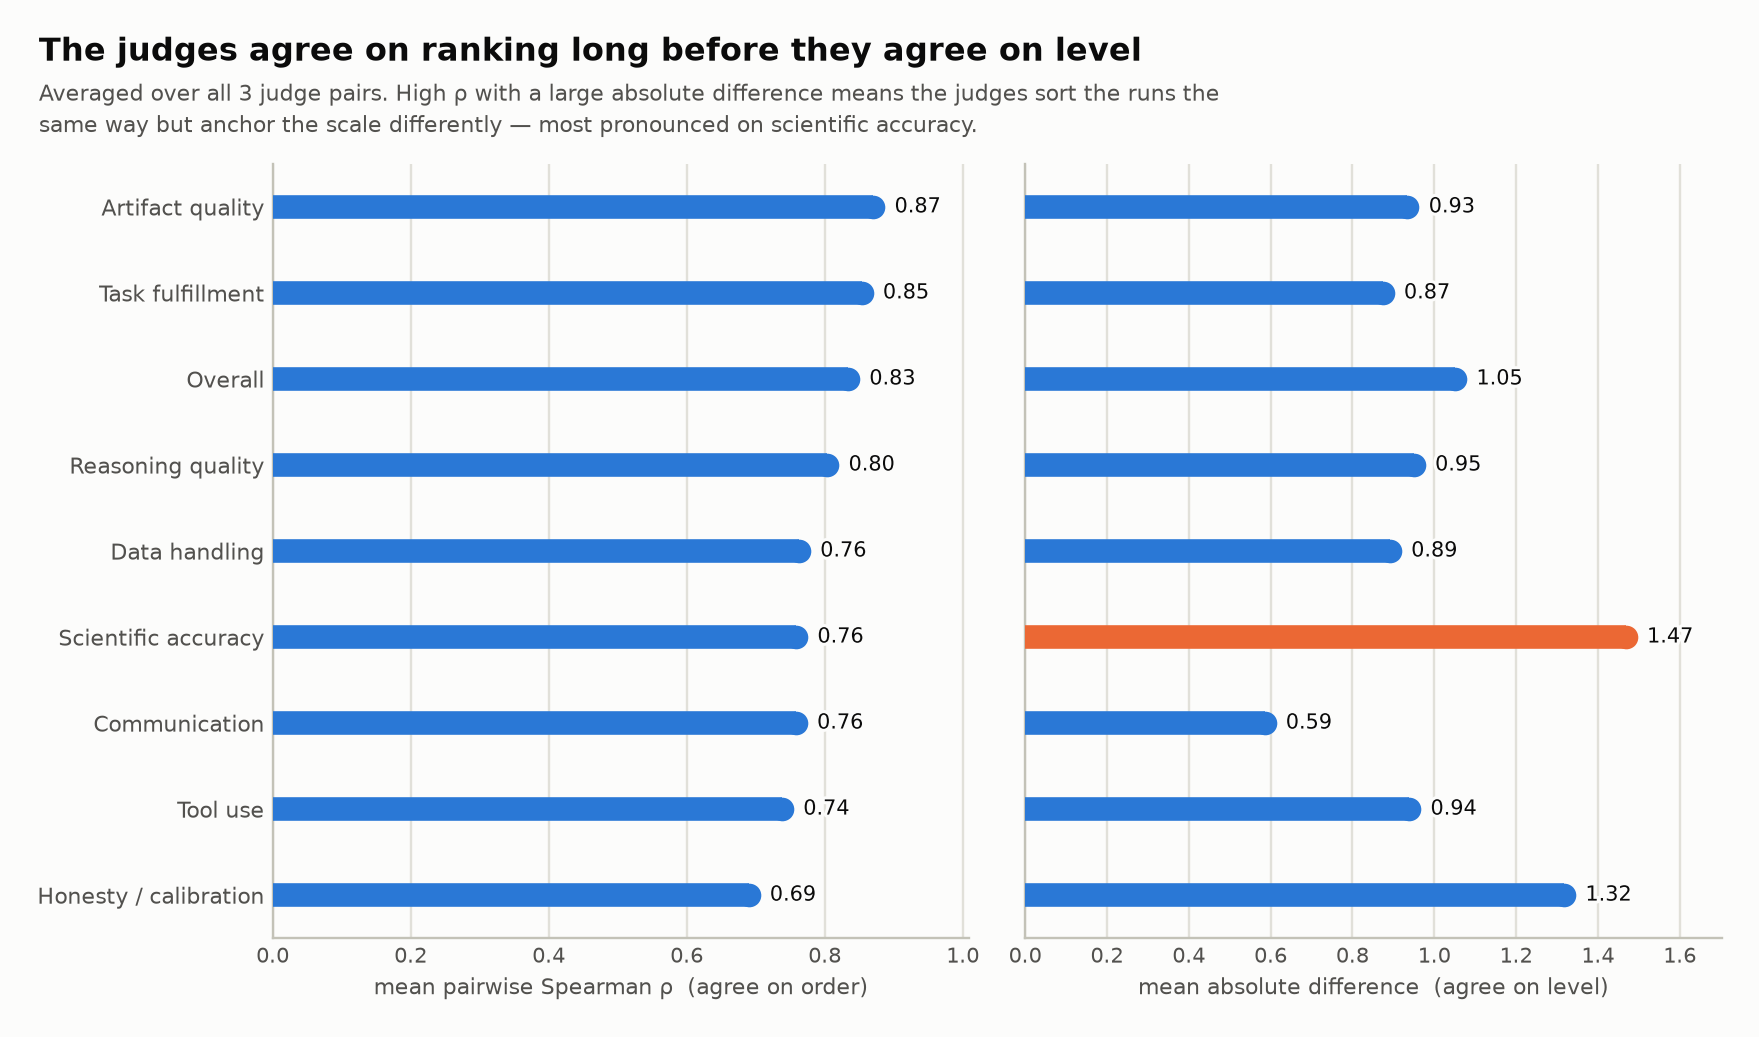
The judges rank runs consistently (Kendall's W across all three judges on model ranking is 0.95) while disagreeing by up to 1.01 points on the absolute level. The ordering is reproducible. The level is a property of the judge, not of the work.
The judges are also contestants, and gpt-5.6-sol grades itself generously
Two of the three judges, gpt-5.6-sol among them, are themselves models in this benchmark, so each one scores its own work. That matters most for gpt-5.6-sol, because it is also the model at the top of the pooled leaderboard: the headline winner helped pick itself. Blinding strips the name off every surface a judge can see: directory names are HMAC blind IDs, vendor strings are redacted from agent-authored text, per-token cost is withheld. But it cannot strip writing style. So we measured the effect: take each judge's opinion of itself relative to everyone else, and subtract the same gap as its peers see it.
| judge | calibration-adjusted self-preference |
|---|---|
gpt-5.6-sol |
+0.83 |
grok-4.5 |
+0.11 |
gpt-5.6-sol rates its own runs +0.83 points above where its peers put them. That is not fraud; it is a measurable thumb on the scale, and it is exactly why a benchmark should never be scored by a single judge drawn from the field it is judging.
The only judge that is not also a contestant is qwen3.8-max. By that judge alone the top of the table reads claude-opus-5 8.29 > gpt-5.6-sol 8.20 > kimi-k3 7.81, a different winner than the pooled ranking. Where the pooled and neutral orderings disagree, trust the neutral one, or trust the unanimous rates, which no single judge can move.
6. What actually makes a task hard
Not the domain. Across the four scientific areas in K-Bench 01 (life sciences, clinical and health, chemistry/drug/materials, and physical sciences/engineering/CS) the pooled means span 0.2 points. No area is a soft target, and no model has a home field.
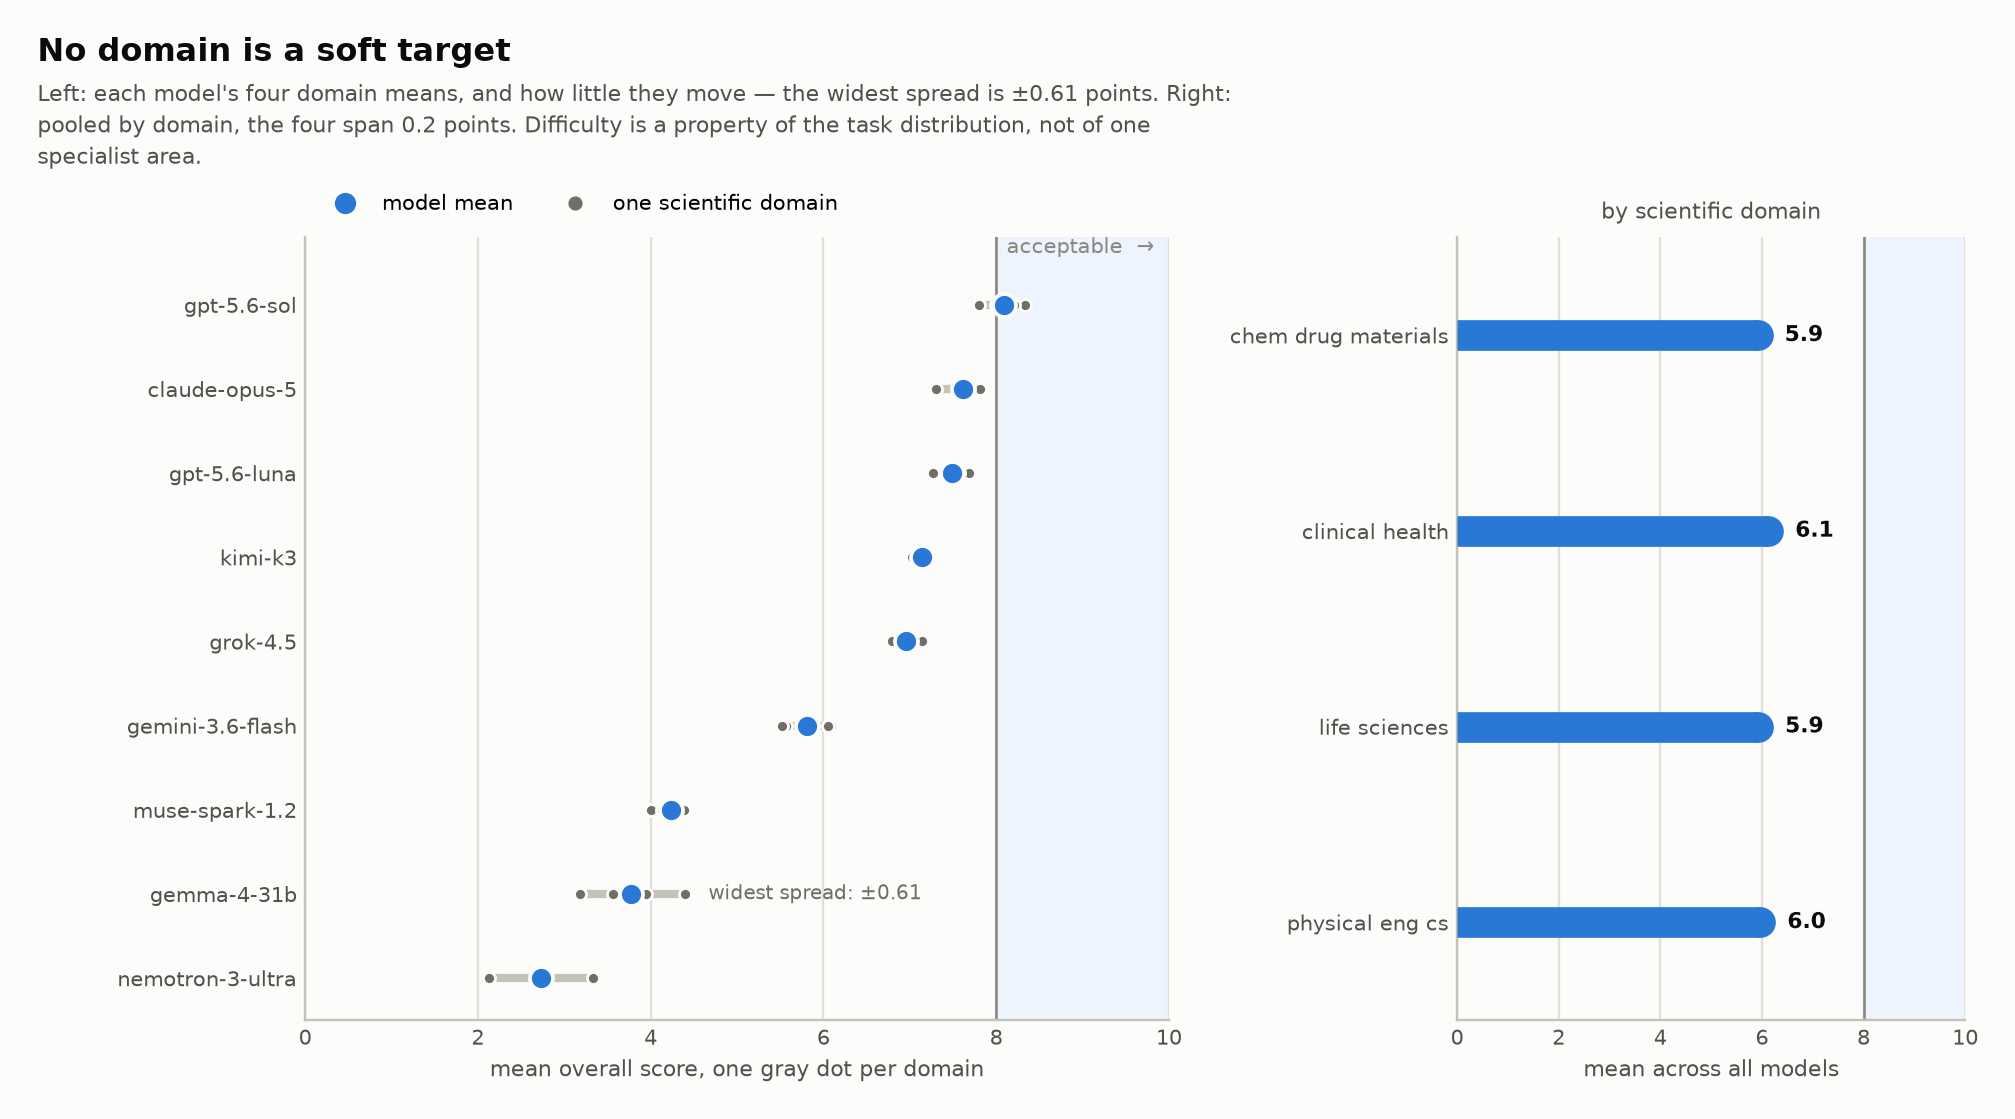
What does predict difficulty is how much the scientist wrote.
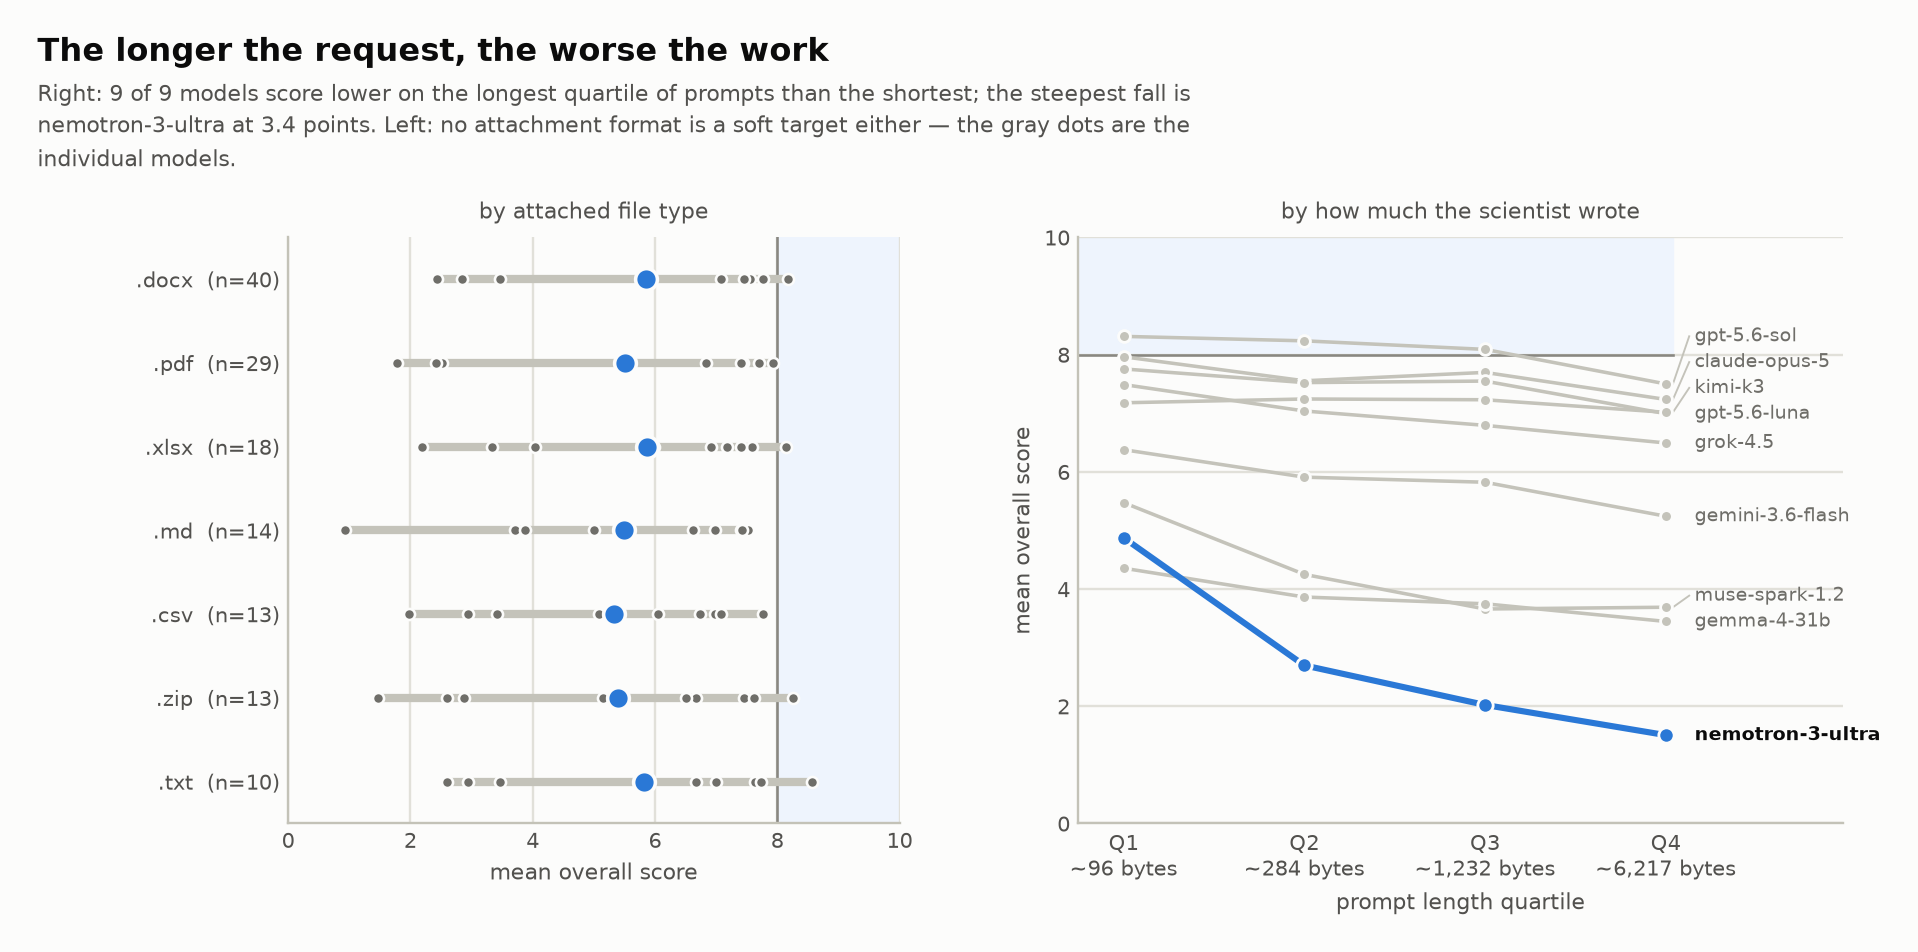
Every model scores lower on the longest quartile of prompts than on the shortest, and the fall is steepest for the weakest models (nemotron-3-ultra-550b-a55b drops 3.4 points). Long, multi-part scientific requests, the kind with six sub-questions, three attachments and a constraint buried in the fourth paragraph, are the hardest part of this distribution. They are also what real scientific work looks like.
And no, you cannot buy your way out of it.
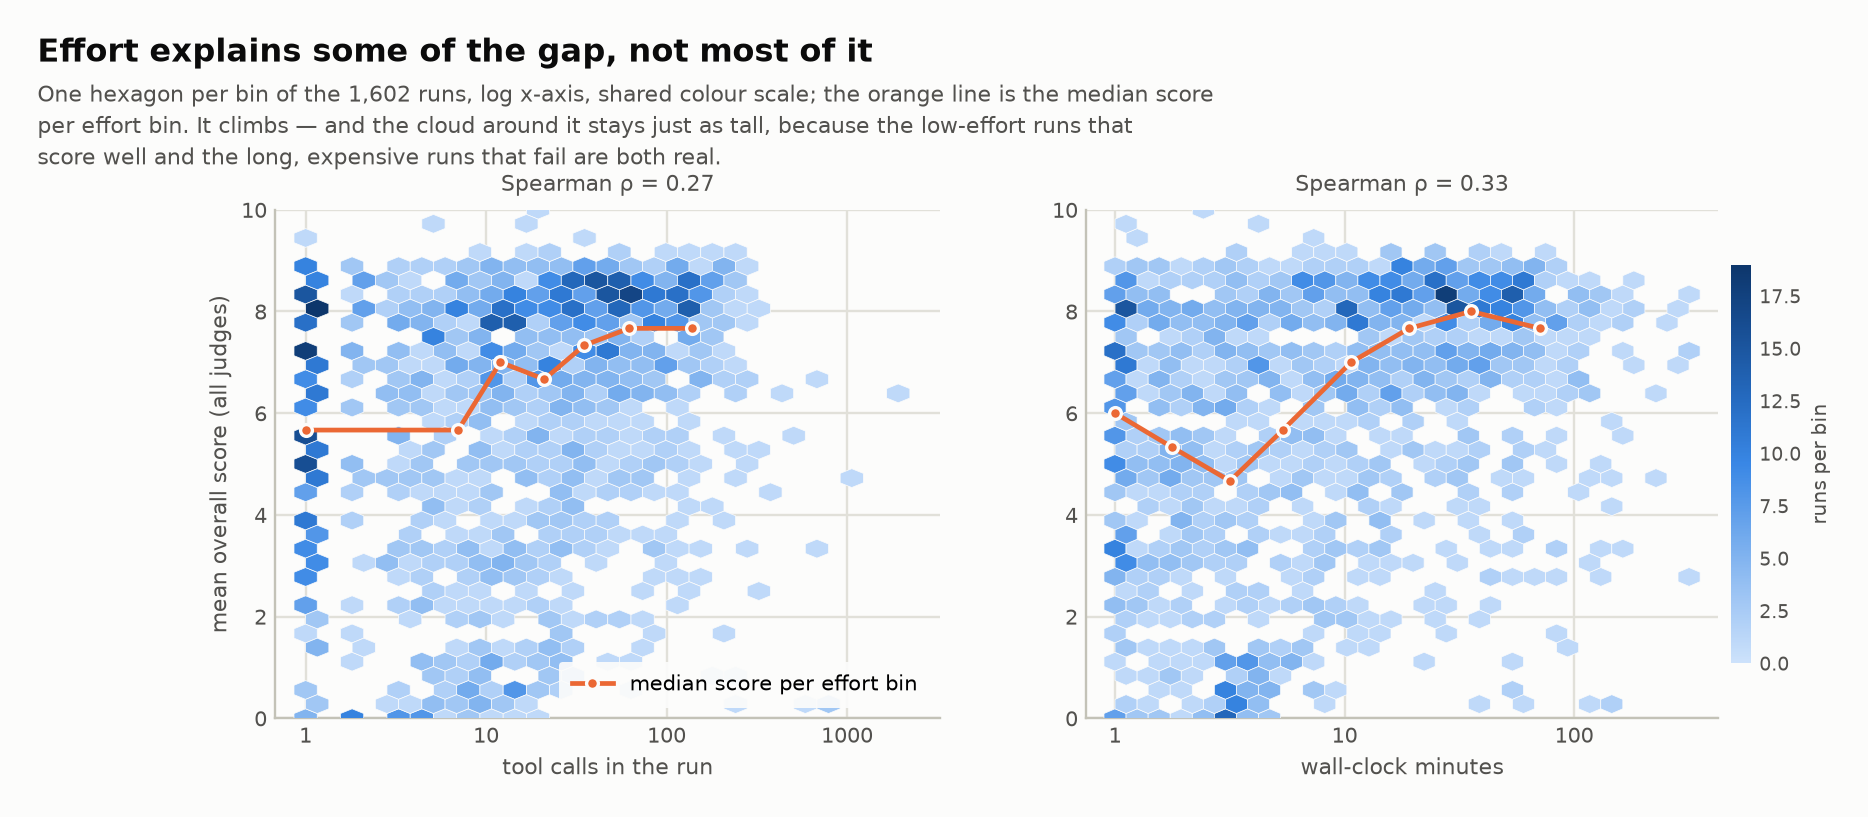
More effort helps, but weakly (Spearman ρ = 0.27 between tool calls and score). The cloud stays just as tall at every effort level: plenty of long, expensive runs fail, and plenty of short ones succeed.
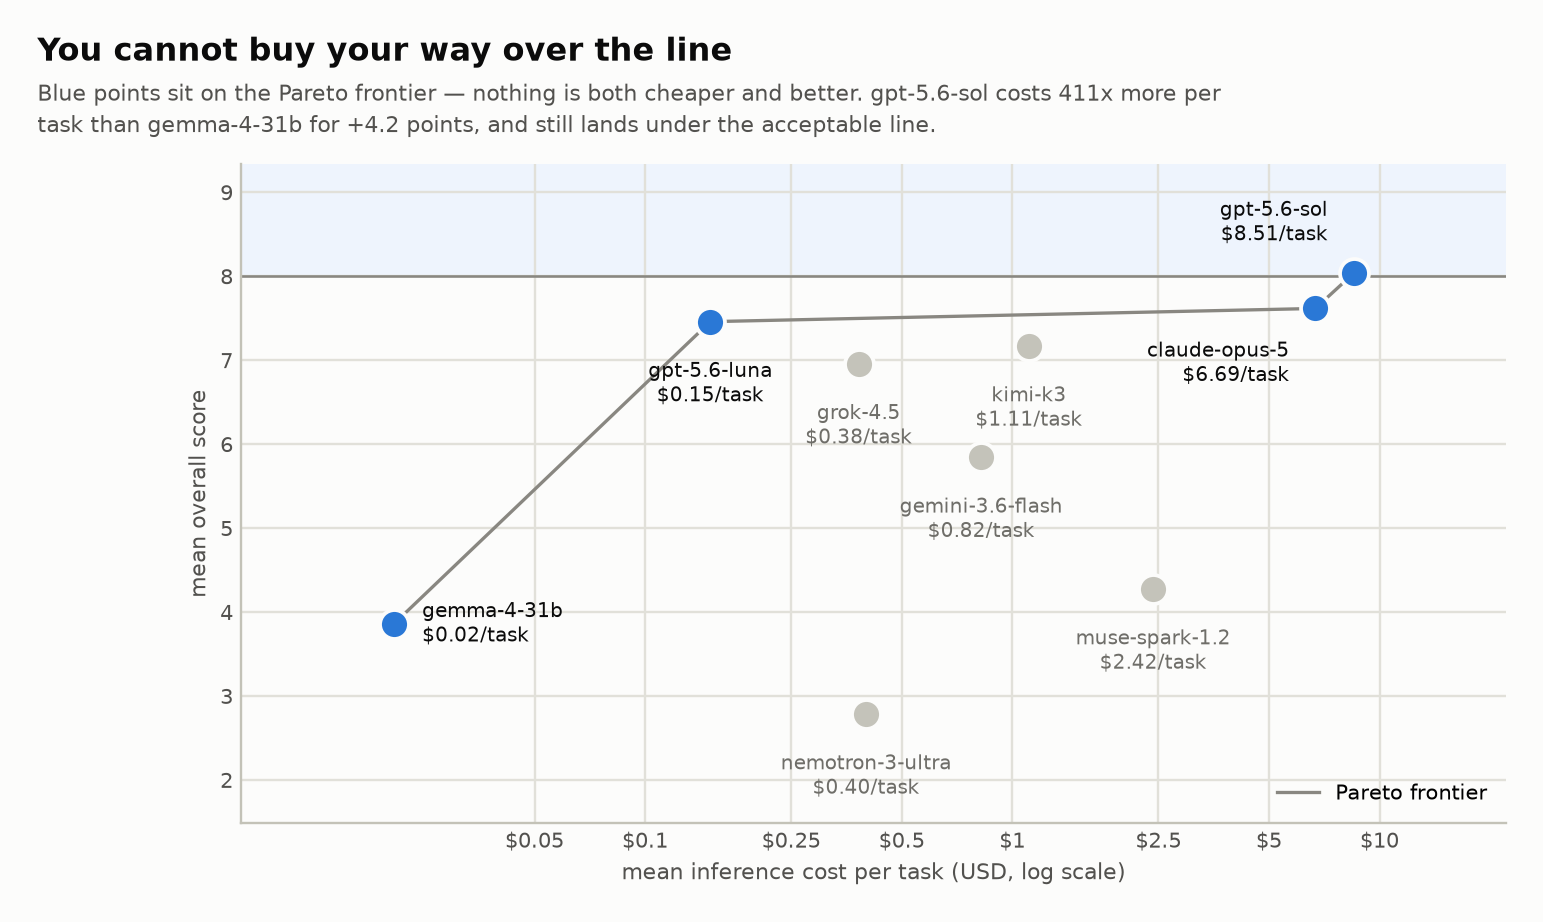
gpt-5.6-sol costs 411x more per task than gemma-4-31b-it ($8.51 vs $0.02) and buys +4.2 points of mean score: real, and still not enough to put the average run comfortably over the line.
7. How we ran it, and what we would not claim
Tasks. 178 sessions sampled from real user traffic, stratified across four scientific domains, reduced to the first user message verbatim plus its attached files. No follow-up turns. No reference answers, because real requests do not come with them.
Runs. Each model in an isolated sandbox running pi (0.84.0) as the harness with its full built-in tool set plus web access, thinking level max requested. No skills, no custom prompts, no sub-agents, no model-specific prompting: the raw model in a stock agentic loop. All 1,602 runs completed.
Judging. Three judges (gpt-5.6-sol, grok-4.5, qwen3.8-max) scored every run as agentic sessions with read/bash/write access. Each received the prompt, the identity-scrubbed answer, a deterministic execution digest of the full transcript, an artifact inventory, and read-only access to the run's actual output files, which they inspected before scoring.
Blinding. Model identity was removed from every judge-visible surface, and the output trees were hashed before and after judging to confirm the judges mutated nothing.
What this does not show
- Absolute scores are judge-calibrated, not ground truth. The ordering of runs reproduces across judges; the level does not. Every difficulty claim above is stated against the most lenient reading for that reason.
- There is no expert human baseline. We do not know what a domain scientist would score on these same tasks, so "8 = acceptable" is a rubric-anchored standard, not a measured human reference.
- Judge-family bias is present and measurable, not merely possible; see the self-preference table above. Prefer the per-judge numbers to the pooled ones wherever they disagree.
- 48% below the line is a real result, but it is not saturation-proof. The best model is at the line already. This benchmark discriminates well today; on this trajectory it will need harder tasks sooner than we would like. That is why it is K-Bench 01: the next edition is already implied.
Why this benchmark exists
Remember what K-Bench 01 actually measured: raw models in a plain harness, with no scientific skills, no custom prompts, and no sub-agents. That baseline is the point. Even the best frontier model, judged partly by itself, barely touches the score where a scientist would accept the work, and 40% of all runs carry an honesty-related failure. This is what you get when you hand a frontier model to a scientist as-is.
It is also exactly the gap that platforms like K-Dense Web and K-Dense BYOK exist to close. They take these same models and wrap them in what the benchmark shows the raw models lack: domain skills, purpose-built prompting, sub-agents that plan, verify and criticize each other's work, and pipelines that insist on artifacts instead of prose. Every failure mode in section 3 (overclaiming above all) is something a platform can be engineered to catch before a researcher acts on it, and the measured behaviors in section 4 (source-checking, self-verification, leaving files behind) are precisely the behaviors a good harness enforces rather than hopes for.
K-Bench 01 is how we choose what to build. It tells us which models to put in front of scientists, where they need scaffolding versus where no scaffolding will help, and which failures the platform has to catch. The tasks and per-run scores stay internal so the evaluation set stays clean, but the full technical report is now available as a pre-print on arXiv, and we will keep publishing what the benchmark teaches us.
If you want to see what these models can do with the machinery this benchmark shows they need, on your own hardest research problems, that is what K-Dense Web is for.
Pre-print: Brueckner, A., Patel, D., He, Y., and Kassis, T. K-Bench: measuring model performance on real scientific agent requests. arXiv:2608.21601