The same 24,562 cells, the same 15,700 gene-by-cell-type tests and the same FDR cutoff give 8,554 significant results or 6,186, depending only on whether the test treats a cell or a donor as the replicate. That 38% swing is not noise in one method. When the agent split control cells into two fake groups of four donors each, a setup in which every discovery is false by construction, the cell-level test reported a median of 855 significant results per split while the donor-level test reported 3. The interferon biology from the original paper holds up. A sizable slice of what a cell-level analysis would call significant does not.
The dataset is the IFN-β stimulation experiment from Kang et al. 2018 in Nature Biotechnology: peripheral blood mononuclear cells (PBMCs) from eight lupus patients, pooled, split into a control and an interferon-stimulated arm, and demultiplexed back to donors from their natural genetic variation (GEO GSE96583). It has become one of the standard teaching datasets in single-cell analysis, and it is also a clean test case for a problem that Hurlbert named pseudoreplication in 1984: treating thousands of cells from eight people as if they were thousands of independent people. Squair et al. 2021 and Zimmerman et al. 2021 showed that this inflates false discoveries in single-cell differential expression, so I asked K-Dense Web to measure how much it matters here.
My prompt asked it to reproduce the main interferon-response findings, find differentially expressed genes per cell type with a cell-level Wilcoxon test, a mixed model with donor as a random effect and a donor-paired pseudobulk DESeq2, and run a within-donor label shuffle as a negative control. I also asked it to write for biologists who use single-cell data but are not statisticians, and to "state clearly which original findings replicate and which do not, without overstating either." The analyst came back with six clarifying questions, I told it to use its best judgment, and I approved its six-step plan. The result is a 33-page report with 92 Crossref-verified references, 11 main and 8 supplementary figures, and 31 scripts. You can browse the full session, including all code and result files, here.
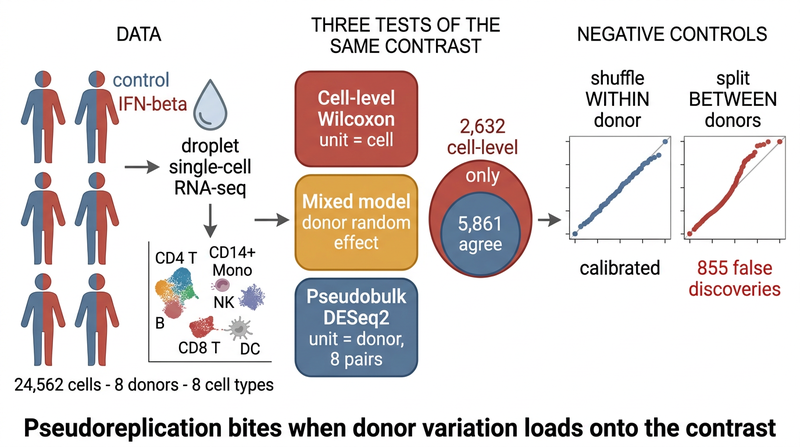 The session's graphical abstract. One dataset of 8 donors and 8 cell types runs through three differential expression strategies and two negative controls.
Checking the Data Before Testing It
Quality control took 29,065 raw barcodes down to 24,562 cells (84.5%). Most of the loss was the authors' own demultiplexing calls: 4,386 barcodes flagged as doublets (3,169) or ambiguous (1,217), which the agent used as given rather than re-deriving. Another 111 cells had fewer than 200 detected genes, and 6 had no cell-type annotation. The 500-UMI filter removed nothing, because the smallest library in the deposit already had 562 UMIs. What remained was 12,261 control and 12,301 stimulated cells across 15,701 genes, with all eight cell types present for all eight donors in both arms, giving 128 donor by cell type by condition groups.
Two quirks of the deposit surfaced in this step. The deposit contains zero mitochondrial UMIs: all 13 MT- genes are annotated, but they carry 0 of the 48,600,925 UMIs in the data, which the agent confirmed through two independent code paths. Rather than applying a mitochondrial filter that would have done nothing, it marked that QC step as not applicable and carried it forward as a limitation of the deposit. In its place it flagged likely stressed and red-cell-contaminated cells with two surrogate rules, kept them, and re-ran the pipeline without them as a sensitivity check; per-cell-type interferon induction barely moved (Spearman 0.976 between runs). It also noticed that hemoglobin genes topped the highly variable gene list because of about 98 erythrocyte-contaminated cells, and dropped those genes from the set tested for differential expression.
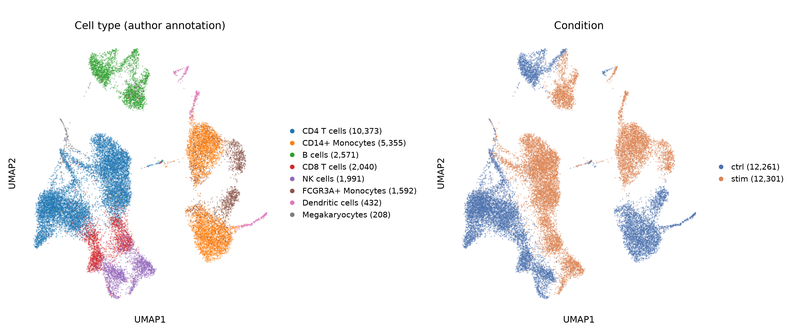 Two panels of the session's UMAP figure. Cell types separate well (cell-count-weighted Leiden cluster purity against the author labels is 0.894), and within every lineage stimulated cells shift away from controls.
The annotation check had its own wrinkle. The least pure cluster (purity 0.49) splits almost evenly between CD8 T and NK cells, which is a familiar boundary in PBMC data, and CD4 itself is detected in under 1% of CD4 T cells. Rather than checking the T-cell labels against a marker that is mostly dropout, the agent built cytotoxic and helper composite scores from several genes each.
Three Tests, One Dataset
The three methods differ in what they count as a replicate. The Wilcoxon test compares individual cells. The mixed model also compares cells but adds a donor term, and the agent ran it twice, once with a donor random intercept and once with a donor-specific random slope as a sensitivity arm. Pseudobulk DESeq2 sums each donor's cells into one sample per condition and fits ~ donor + condition, so each donor contributes one paired comparison, which matches how the experiment was actually designed.
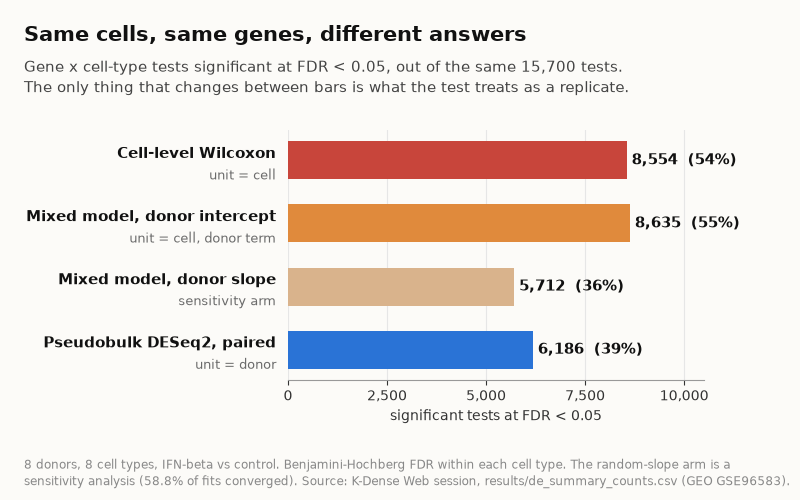 Significant gene by cell type tests at FDR < 0.05 out of the same 15,700 for each method. The only thing that changes between bars is what the test treats as independent.
The random-intercept model landed almost exactly on the Wilcoxon count (8,635 versus 8,554), and the agent offered an explanation. In a paired design every donor sits in both arms, so a donor intercept only soaks up baseline differences that the comparison already cancels. The estimated donor share of variance (the ICC) had a median below 0.02 in seven of eight lineages, and 59.4% of fits ended at the boundary where the donor term is zero. It also flagged where that explanation falls short: CD14+ monocytes have by far the highest donor share and the lowest convergence rate, yet their mixed-model and Wilcoxon counts are as close as anywhere else (2,984 versus 2,951). The variation that matters here is donors responding differently to interferon, which only the random-slope arm can see, and that arm dropped to 5,712, though only 58.8% of its fits converged. The report's conclusion is that adding a random intercept is not the fix for pseudoreplication in this design.
| Overlap category | Gene by cell type effects |
|---|---|
| Significant under all three methods | 5,861 |
| Wilcoxon and mixed model, not pseudobulk | 2,454 |
| Mixed model only | 299 |
| Pseudobulk only | 243 |
| Wilcoxon only | 178 |
| Wilcoxon and pseudobulk, not mixed model | 61 |
| Mixed model and pseudobulk, not Wilcoxon | 21 |
The disagreement is about certainty, not direction or size. Across cell types the median Spearman correlation between the Wilcoxon and pseudobulk effect sizes is 0.977 (about 0.93 for the mixed model against either), so the methods rank genes very similarly and differ mostly in how confident they are. The agent also warned that a fold-change cutoff such as |log2FC| > 1 cannot be applied uniformly across methods, because the mixed model reports effects on the log1p scale rather than as a log2 fold change.
What the 2,632 Cell-Level-Only Effects Look Like
The step I found most useful was the characterization of the 2,632 effects that the Wilcoxon test calls significant and the donor-paired test does not. The obvious hypotheses are that these genes are noisier between donors, that one outlier donor drives them, or that they are low-detection genes where zero inflation misleads the cell-level test. The agent tested each one against the 5,922 effects both tests agree on, and each one failed.
| Property | Cell-level only (2,632) | Both agree (5,922) |
|---|---|---|
| Between-donor SD of log2 fold change | 0.484 | 0.483 (p = 0.19) |
| Effect retained after dropping the most extreme donor | 0.926 | 0.943 |
| Baseline detection rate | 14.6% | 13.7% |
| Donor-level Cohen's d | 0.91 | 2.01 |
| Mean donor log2 fold change (absolute) | 0.441 | 0.965 |
| All 8 donors agree in direction | 22.3% | 72.5% |
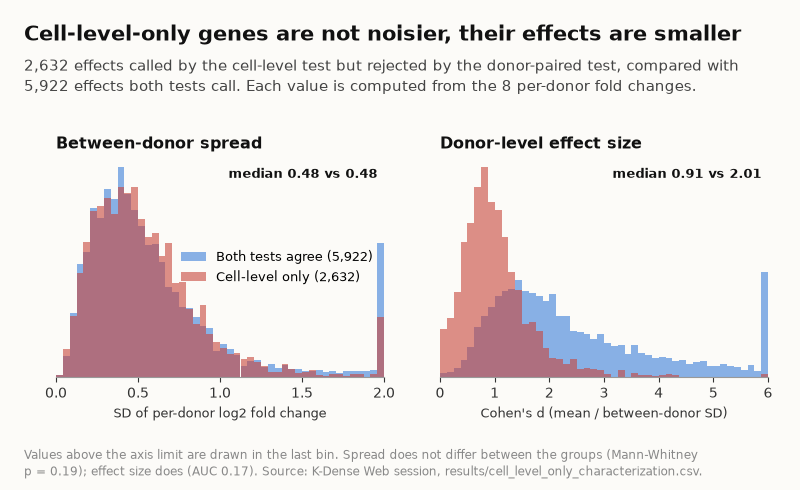 Left: the two groups have the same between-donor spread. Right: the cell-level-only effects are about half the size at the donor level, which is what separates them (AUC 0.17).
The answer is that these effects are small. Their spread across donors is the same as everyone else's, but the signal sitting on top of that spread is about half the size, and all eight donors change in the same direction for only 22% of them, against 73% of the effects both tests agree on. A cell-level test still calls them significant because thousands of cells shrink its standard error regardless of how many people they came from. The report is careful about the conclusion: these effects are not supported at the donor level, which is not the same as proving them false, and with only eight donors some of them may be real effects that the experiment is too small to confirm.
Two Negative Controls, Two Different Answers
The negative control I asked for was a within-donor label shuffle: randomly reassign "control" and "stimulated" among each donor's cells and see how often each method still finds something. The agent ran 8 permutations across four lineages (CD14+ monocytes, CD4 T, B and NK cells), for 200,432 p-values in total. It also added a second null that I had not asked for: take control cells only, split the eight donors four against four in all 35 possible ways, and test each split as if it were a treatment. Both are built from the real data, so real donor heterogeneity and real within-donor correlation are preserved, and in both every significant call is a false positive by construction.
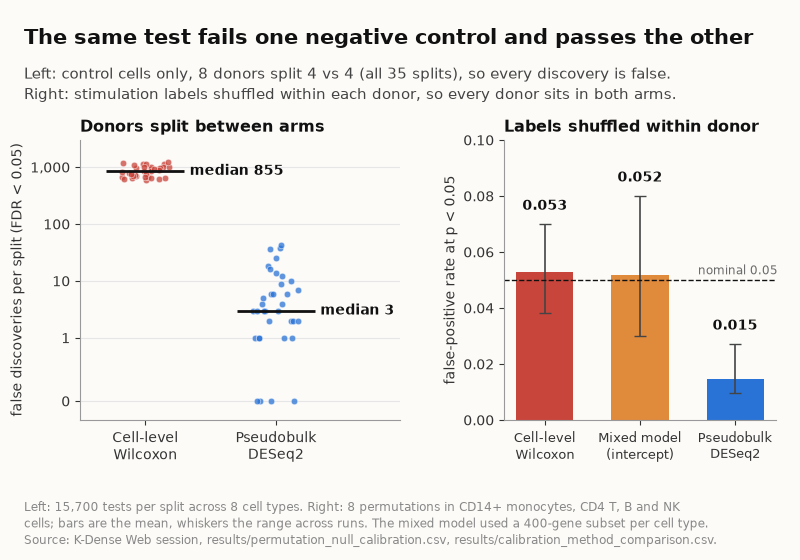 Left: all 35 four-versus-four donor splits of control cells, where every discovery is false. Right: the within-donor shuffle, where the cell-level and mixed-model tests sit at the nominal 5% false-positive rate and pseudobulk falls below it.
The two nulls gave opposite verdicts on the cell-level test. Under the within-donor shuffle, the Wilcoxon test looked well calibrated, with a false-positive rate of 0.053 (range 0.038 to 0.070 across runs), a genomic inflation factor of 1.023 and 0.25 false discoveries per permutation. The real-data discovery rate in those four lineages was 0.534, and under the shuffle it fell to 2.1 × 10⁻⁵. Under the between-donor split, the same test produced a median of 855 false discoveries per split (range 603 to 1,222, or 5.4% of all tests), compared with a median of 3 (range 0 to 42) for pseudobulk, about 285 times more. The cell-level error also grew with the number of cells in the split, while the donor-level error did not.
The report treats this as one result rather than a contradiction. Shuffling labels within a donor removes not only the average interferon effect but also the differences between donors in how strongly they respond, and those differences are what a cell-level test ignores in the real paired experiment. So the shuffle I asked for is not in a position to detect the failure at all: in the report's words, the between-donor null exhibits the problem and the within-donor null is silent on it. Pseudobulk DESeq2 was conservative under that shuffle (false-positive rate 0.015, inflation factor 0.640, zero discoveries), and the report notes that this caution costs power, by an amount the session did not measure. The mixed model was calibrated on average (false-positive rate 0.052 on a 400-gene subset), but the agent found a degenerate fit in B cells that returned p = 3.8 × 10⁻⁶⁷ under the null, against minimum null p-values of 1.2 × 10⁻⁶ for Wilcoxon and 2.1 × 10⁻⁵ for DESeq2. A method can be calibrated on average and still produce a single wildly significant false positive, which is the kind of failure an average false-positive rate hides.
Which Kang Findings Replicate
The report closes with a replication ledger that gives each claim its own status, deliberately not a single verdict. Every comparison with the original paper is qualitative, about direction and ordering, because the paper's numeric effect sizes were not available in the session. The ledger also keeps a few rows that are not claims from the paper, and the table marks them.
| Finding | Status |
|---|---|
| IFN-β produces a global transcriptional shift in every lineage | Replicates |
| Canonical interferon-stimulated genes are induced in all cell types (61 of 61 panel effects) | Replicates |
| Myeloid cells mount a stronger response than lymphoid cells | Replicates |
| Part of the response is cell-type specific | Replicates |
| Thousands of genes are differentially expressed per cell type | Replicates with qualification (the count moves 38% with the test) |
| The 2,632 effects significant only at the cell level (not a Kang claim) | Does not replicate under donor-aware testing |
| Published numeric effect sizes and demuxlet donor assignment | Not tested |
| Mitochondrial QC (not a Kang claim) | Not applicable (no mitochondrial reads in the deposit) |
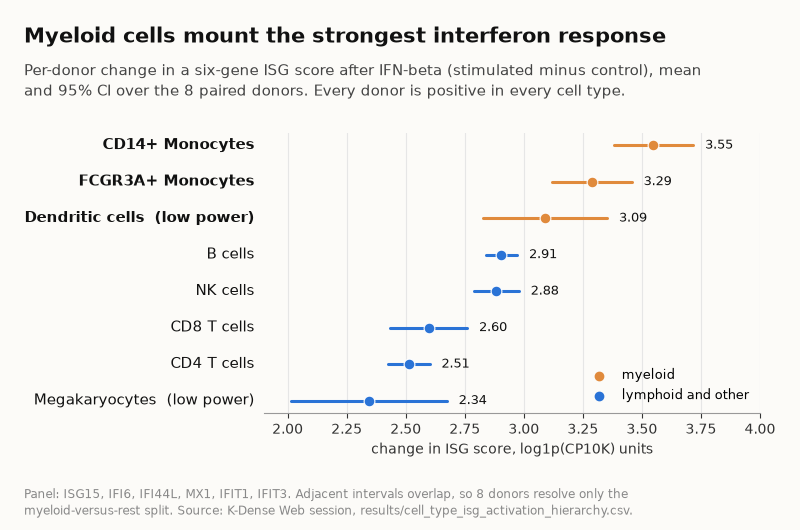 The per-donor change in a six-gene ISG score, with 95% intervals over the eight paired donors. The top three are the myeloid lineages. Both monocyte lineages sit clearly above every lymphoid lineage, but the dendritic-cell interval overlaps B and NK cells, and adjacent intervals within each group overlap.
The hierarchy result is a useful counterexample to the rest of the post. Ranked by the donor-level score, CD14+ monocytes respond most (3.55, 95% CI 3.38 to 3.72), followed by FCGR3A+ monocytes (3.29) and dendritic cells (3.09), with megakaryocytes lowest (2.34), and every donor is positive in every cell type. The ranking agrees with the descriptive pooled-cell ranking at a Spearman correlation of 0.96, so for this question the cell-level shortcut gives the right answer. The agent reported that instead of overselling the donor-level method, and it also pointed out that eight donors cannot resolve the order within the myeloid or the lymphoid group.
The robust gene table keeps only effects that are significant under all three methods, agree in sign and go the same direction in all eight donors. That leaves 4,290 effects across 2,279 genes. Fifteen genes meet that bar in all eight lineages: IFIT1, IFIT3, IFIT2, ISG15, IFI6, MX1, LY6E, ISG20, PSMB9, PSME2, TMSB10, HLA-C, B2M and HLA-B are induced, and RPL6 is repressed. Relaxing to seven lineages gives 67 genes and to six gives 120.
What the Agent Flagged About Its Own Output
The session did not go cleanly, and it said so. The first attempt at Step 3 hit its budget cap before the consolidation script ran, so the merged differential expression tables and the verification suite were never built. The methodology review for that step marked it as a fail, and the agent ran the missing script, wrote a new verification suite and passed all 82 of its checks before moving on. Across the five analysis steps (the sixth was the report), 322 automated checks were run against the files on disk.
The draft report then went through an internal peer review, which found eight numerical errors and asked for them to be fixed before release. Some were small, such as the pseudobulk residual degrees of freedom written as 6 instead of 7 because of an off-by-one in a script, and three genes placed in the wrong robustness tier. One was more substantive: the draft gave the cell-level discovery rate on the real data as 0.40, close to the pseudobulk rate, while the session's own verification output said 0.534. The reviewer also asked for the two negative controls to be framed as one probe that sees the problem and one that cannot, rather than as a disagreement. All eight numerical fixes made it into the final report, and the numbers in this post come from that report and the result CSVs. The reframing landed in the report's discussion, although one earlier sentence still calls the two nulls a disagreement.
The limitations are stated plainly in the report. It did not compare its fold changes with the paper's published values, because no supplementary table was obtained. It used the authors' demuxlet calls as input, so the paper's central methodological claim about demultiplexing is not re-tested. Dendritic cells and megakaryocytes have few cells per donor and are labeled as low power throughout, and the pseudobulk method's conservatism means that some of the 2,632 cell-level-only effects may be real.
What This Means for Single-Cell Studies
The practical advice in the report fits in one line: report the number of donors, not the number of cells, because the donors are what limit how certain you can be about a population-level effect. A cell-level test is not useless. In this dataset it ranks genes the same way the donor-level test does and gets the cell-type hierarchy right. It is the p-value that misleads, and in the donor-split control it misled more as the split held more cells, which is the opposite of what most people would expect from more data.
The broader lesson is about what a reproduction should look like. Re-running the original analysis and getting the original numbers would have been easy and not very informative. What this session did was add the negative control that the problem actually needed, explain why one method's false-positive rate looked fine while another null showed it badly inflated, and give each original claim its own verdict instead of a single replicates-or-not label. That is the argument we made in reproduction, not generation, and the same kind of self-audit showed up when K-Dense Web caught a circular benchmark in its TP53 analysis.
Try it yourself at app.k-dense.ai, or browse the full session, including every script and result file, here. Questions? Contact us at contact@k-dense.ai.