A single crystal structure of p53 bound to DNA correctly explains nine of the ten most common cancer mutations in its DNA-binding domain, yet it misses 1,116 substitutions (almost a third of the 3,629 possible) that experiments show destroy the protein's function. Of the 92 variants in that missed group that carry a definitive ClinVar label, 91 are pathogenic. The structure is not wrong about the famous hotspots. It is wrong about a large, clinically real population of variants whose mechanism lives outside the crystal.
TP53 is mutated in roughly half of human cancers, mostly by missense substitutions that cluster in the DNA-binding domain (residues 102 to 292). That domain has been structurally characterized since the 1994 co-crystal of the p53 core domain bound to DNA, so it is the natural place to ask a simple question: how much of a variant's functional and clinical effect can you read off the structure, and where does that reading break down? I gave K-Dense Web one prompt asking it to integrate ClinVar, protein structure, evolutionary conservation and the literature, identify where structural and functional evidence agree or conflict, and produce publication-quality figures. After one clarifying exchange (I asked it to focus on the DNA-binding domain) and my approval of its research plan, it ran the whole analysis on its own.
The result is a 29-page technical report with 72 verified references, four figures and nine tables, plus every script, intermediate table and QC file. As with our ring-road traffic simulation, what stands out in this session is not just the headline result but how much of the work went into checking it, including the moment the agent realized that its own best-looking model was circular. You can browse the full session, including all code and result files, here.
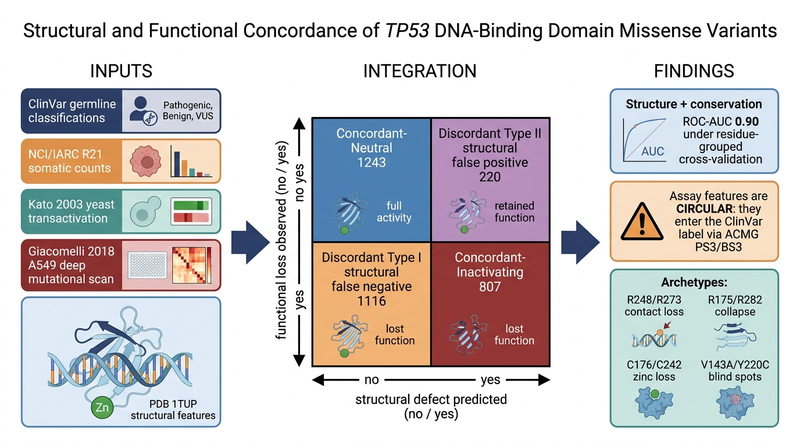 The session's graphical abstract. Four annotation sources and PDB 1TUP are combined, and every substitution with a confident call is placed in a 2 × 2 grid of predicted structural defect against observed loss of function. The counts in the matrix are the values in the session's classification table.
Building the Complete Substitution Grid
Rather than analyzing only the variants that happen to be reported somewhere, the agent built the full grid: 191 positions × 19 alternative amino acids = 3,629 substitutions. That choice makes every count interpretable, because a missing annotation is recorded as missing instead of silently shrinking the dataset. It then pulled five public sources and joined them on canonical UniProt P04637 numbering.
| Source | What it contributes | DBD substitutions covered |
|---|---|---|
| ClinVar (NCBI E-utilities) | Germline clinical classification and review stars | 802 |
| NCI/IARC TP53 Database release R21 | Somatic tumor counts | 1,041 observed in tumors |
| Kato et al. 2003 via the NCI mirror | Yeast transactivation on 8 p53 promoters | 1,129 |
| Giacomelli et al. 2018 via MaveDB | Deep mutational scan in human A549 cells | 3,629 (complete) |
| PDB 1TUP | 2.2 Å coordinates of the core domain bound to DNA | 188 of 191 positions resolved |
Only 732 substitutions are annotated by all four annotation sources at once, which already says something about how thin the clinical evidence is compared with the experimental data. Before merging anything, the agent scanned every source across numbering offsets of -3 to +3 against the reference sequence, because MaveDB warns that the Giacomelli screen used an older TP53 reference. All sources peaked at offset zero, and a final assertion checked the wild-type residue of all 3,629 rows.
Two curation decisions in this step changed the analysis. The IARC MutationView file contains a row for every possible substitution, so treating row presence as "seen in a tumor" would have inflated the somatic set about 3.5-fold. The agent defined somatic observation as a count above zero instead, which gives 1,041. It also checked its own "cross-validations" and downgraded them: its median over the eight Kato promoters matched the median deposited in MaveDB exactly (n = 2,314), and it pointed out that exact agreement means both came from the same primary table, so this confirms the arithmetic but is not an independent measurement.
Reading Structure from the Crystal
The 1TUP crystal contains three p53 core domains (chains A, B and C) on one DNA duplex, and they do not all touch DNA the same way. Instead of picking a chain by convention, the agent counted residues within 4.0 Å of DNA in each chain (A = 4, B = 14, C = 5) and chose chain B as the representative DNA-binding monomer. That choice mattered. Under a looser "minimum distance across all chains" policy, Q165, Q167 and H168 would count as DNA contacts, but they sit 2.9 to 3.3 Å from DNA only in chain A and 9 to 14 Å away in chains B and C. The agent identified this as crystal packing against a neighboring duplex, not real DNA recognition, and excluded them.
The geometry then passed its positive controls. All seven canonical DNA-contact residues it tested (K120, S241, R248, R273, C277, R280, R283) fall within 4.0 Å of DNA, and all four zinc ligands (C176, H179, C238, C242) fall within 2.8 Å of the zinc ion. The three residues that 1TUP does not resolve (R290, K291, K292) were left without structural features rather than modeled, and their 57 substitutions were set aside as indeterminate.
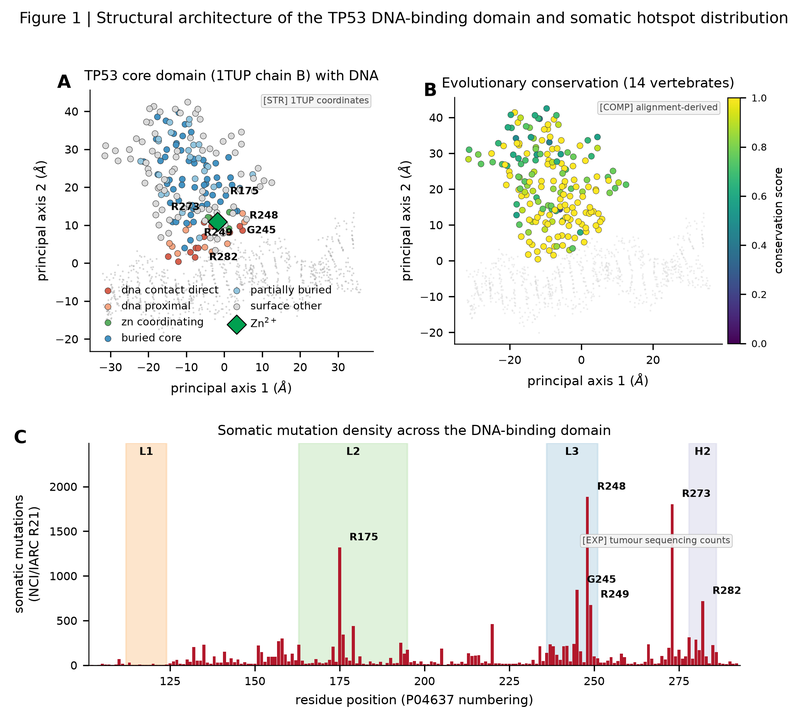 (A) DNA-binding domain residues of 1TUP chain B colored by structural role, with DNA in gray and the zinc ion as a green diamond. (B) The same residues colored by conservation across 14 vertebrate orthologs. (C) Somatic mutation counts per position from NCI/IARC R21, with the L1, L2, L3 and H2 regions shaded. The tallest peaks are R248 and R273, followed by R175.
The report is explicit about what was not computed. No force field was run, so there is no predicted ΔΔG anywhere in the analysis. The structural severity score is a hand-weighted heuristic built from burial, Grantham distance, volume and hydrophobicity changes, and the agent labeled it in arbitrary units with a warning that it must never be read as a folding free energy. Conservation came from pairwise alignments of 14 vertebrate orthologs projected onto the human sequence, because no multiple-alignment tool was available in the environment, and that limitation is carried into the conclusions.
A Rule Set That Failed the Hotspots, and Why That Was Reported
To call a substitution structurally defective, the agent wrote six biophysical rules (zinc-ligand disruption, DNA-contact disruption, severe substitution at a buried position, and so on) and fitted none of their parameters to any functional or clinical label. The first version of the rules classified R175H, G245S, R249S, R273H and R282W as structurally benign. These are the best-characterized structural hotspots in p53 biology, so the agent treated this as a defect in its rules rather than a discovery.
It traced the failure to two causes. A charge table encoded histidine as +0.5, so an arginine-to-histidine change never registered as loss of positive charge, and R273H, one of the most common DNA-contact mutants in human cancer, failed the contact rule. At pH 7.4 histidine is about 90% neutral, so the corrected rules treat it as uncharged. The rules also lacked three standard criteria: loss of a buried charge, substitution of a buried glycine, and any non-conservative change at a direct DNA contact. The revised rules raised sensitivity against functional loss from 0.333 to 0.420 and lowered specificity from 0.906 to 0.850.
The part I appreciated most is the honesty note that follows. Because the known hotspots prompted the revision, the report states that they cannot count as held-out evidence for the new rules, and that agreement with them is not validation. Both rule versions are kept as separate columns in the output table so anyone can audit exactly what changed.
Structure Explains the Hotspots and Misses a Third of the Grid
With structural and functional calls in hand, every substitution falls into one cell of a 2 × 2 table. Functional loss was defined by the Kato convention of 20% or less of wild-type transactivation where Kato data exist, and by a Giacomelli score threshold calibrated against Kato (not against ClinVar) everywhere else.
| Class | Substitutions | ClinVar pathogenic | ClinVar benign |
|---|---|---|---|
| Concordant-Neutral (structure benign, function retained) | 1,243 | 5 | 33 |
| Discordant Type I (structure benign, function lost) | 1,116 | 91 | 1 |
| Concordant-Inactivating (structure defective, function lost) | 807 | 105 | 0 |
| Discordant Type II (structure defective, function retained) | 220 | 1 | 3 |
| Indeterminate (no confident functional call) | 186 | 13 | 2 |
| Indeterminate (unresolved in 1TUP) | 57 | 0 | 3 |
Where structure and function agree (2,050 substitutions, 56.5% of the grid), the clinical labels agree as well: 105 pathogenic and zero benign variants in the inactivating cell, and 33 benign against 5 pathogenic in the neutral cell. The hotspots sit comfortably in the concordant region, and nine of the ten most frequently observed substitutions in tumors (R175H, R248Q, R273H, R248W, R273C, R282W, G245S, R249S and Y220C) are concordant, inactivating and pathogenic. This is exactly why intuition built on hotspots overstates how well structure explains the domain as a whole.
The largest discordant cell tells the other half of the story. The 1,116 Type I variants lose function while every structural rule calls them benign, and they are clinically real rather than borderline. Even the tenth most common tumor substitution, V157F (213 tumor records, 10.95% of wild-type activity, ClinVar pathogenic), falls in this group. Decomposing the Type I group shows two main failure modes: 573 variants sit at solvent-exposed positions where a single monomer has no feature to flag, and 356 are buried but carry a substitution that a composition-based severity score rates as mild.
The Clearest Failure: V143A and Y220C
The second failure mode is easiest to see in a pair of variants that the rule set treats very differently. Both are buried, both are far from DNA and zinc, both are ClinVar 3-star pathogenic, and both lose most of their transactivation. Their experimentally measured destabilizations, taken from Joerger, Ang and Fersht (2006), are 4.0 kcal/mol for Y220C and 3.7 kcal/mol for V143A, which is a difference of only 0.3 kcal/mol.
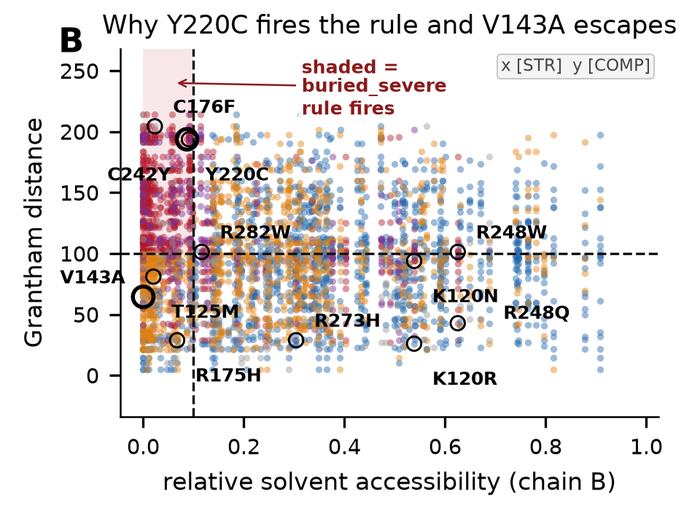 Panel B of the session's Figure 2. The shaded box is where the buried-severe rule fires. Y220C (Grantham 194, RSA 0.087) falls inside it, while V143A (Grantham 64, RSA 0.000) falls below the Grantham threshold and escapes, even though it is more deeply buried.
Tyrosine to cysteine is a large change in the Grantham table, so Y220C fires the rule and is classified correctly. Valine to alanine scores 64, below the severity cut, so V143A lands in Type I. Grantham distance measures how different two amino acids are in the abstract, while trimming a valine side chain down to alanine in a tightly packed core leaves a cavity whose cost depends on the local environment. The report adds that Y220C is right for an incomplete reason: the rule fires because the change is large and buried, but it has no concept of the surface cavity that makes Y220C druggable. V143A adds a second lesson, because it is a classic temperature-sensitive mutant (active at 32 °C, inactive at 37 °C), and a single static functional label cannot represent that.
Before using any ΔΔG value, the agent checked it against the literature during the session and recorded how. Only 3 of the 12 case-study variants ended up with a number: two (Y220C and V143A) confirmed in the primary paper, and one (R175H, about 3.0 kcal/mol) taken from a secondary summary and flagged as the weakest of the three. The other nine carry a deliberately empty field. The verification script was written to fail the run if any variant marked unverified carried a number, which is a simple guard against one of the most common ways AI-written science goes wrong.
When the Assay Cannot See the Mechanism: K120R
K120 makes a direct DNA contact and is also acetylated by Tip60/hMOF, a modification that steers p53 toward apoptosis. K120R keeps the positive charge and the contact, but arginine cannot be acetylated. On the median of the eight Kato promoters it retains 68% of wild-type activity, so the pipeline calls it Concordant-Neutral.
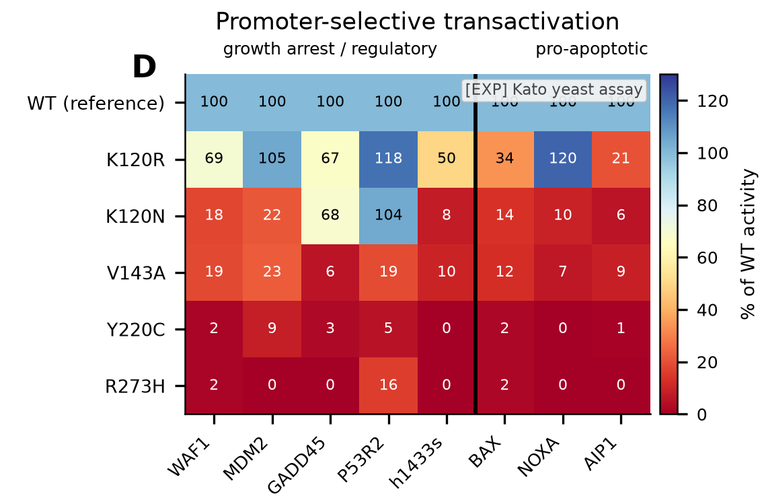 Panel D of the session's Figure 2: Kato transactivation on each of the eight promoters, split into growth-arrest/regulatory and pro-apoptotic groups. K120R stays near or above wild type on MDM2 and P53R2 but drops to 34% on BAX and 21% on AIP1.
Because the agent kept the promoter-level data instead of collapsing it early, it could see the hint of the expected defect: the two lowest promoters for K120R are the pro-apoptotic AIP1 and BAX. It also reported that the pattern is only partial, since the pro-apoptotic NOXA promoter reads 120%. The deeper problem is that the Kato assay runs in yeast, and S. cerevisiae has no Tip60/hMOF, so the assay cannot detect an acetylation-dependent defect at any threshold. The report describes K120R as a kind of discordance its own partition cannot represent, because the structure and the assay are both measuring the wrong thing.
The Model That Looked Too Good
The session then asked how well the features predict ClinVar pathogenicity. The benchmark is small, 257 variants (215 pathogenic, 42 benign) across 124 residues, and the agent noticed a trap in it: only 9 of the 124 residues contain both a pathogenic and a benign variant, so 92.7% of positions carry a single label. Since many features are identical for all 19 substitutions at a position, ordinary cross-validation lets a model recognize positions it has already seen labeled. It therefore used cross-validation grouped by residue (5 folds, 20 repeats), with decision thresholds chosen on the training folds only.
Under that scheme, structure alone reached a ROC-AUC of 0.843, conservation alone 0.826, and structure plus conservation 0.903 (0.878 to 0.918 across repeats), so the two carry partly independent information. Adding the functional assays pushed the ROC-AUC to about 0.99, and this is where the session did something I think a lot of published benchmarks do not.
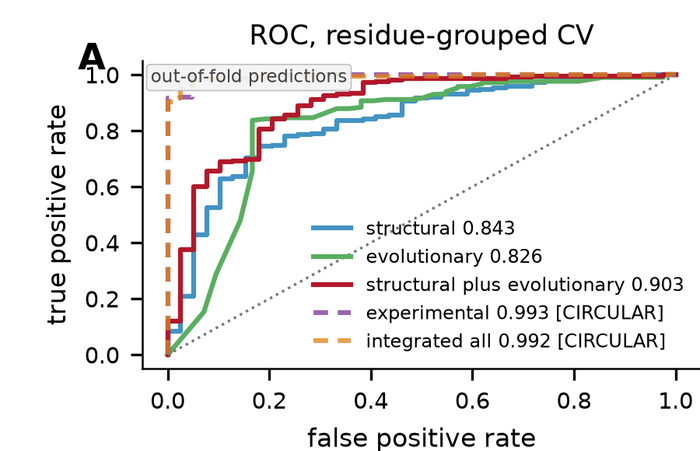 Panel A of the session's Figure 3: out-of-fold ROC curves. The dashed curves near the top-left corner are the feature sets that include the Kato or Giacomelli assays, which the agent marked as circular. The defensible headline is structure plus conservation at 0.903.
The agent recognized that ClinVar TP53 classifications are not independent of those assays. The ClinGen TP53 expert panel specification applies functional evidence through the ACMG/AMP PS3/BS3 criterion, so a model that uses the Kato or Giacomelli data to predict ClinVar is partly reading back the evidence that produced the label. This is the well-known circularity problem in variant effect benchmarking. To test it, the agent stratified by ClinVar review tier and found that within the 1-star tier, Kato transactivation separates pathogenic from benign perfectly (|AUC| = 1.000 over 35 variants, 14 of them benign). A flawless separator is not what an independent biological measurement looks like, so the report presents the 0.99 models as an audit only and leads with 0.903 instead.
What the Agent Flagged About Its Own Output
The report is also candid about its limits, and several of those caveats go further than the analysis steps themselves did. The threshold sweep shows that the Type I group is stable when the Kato cutoff moves from 10% to 30% (1,009 to 1,166 variants). The Giacomelli cutoff is a different story: raising it to the 90th percentile shrinks Type I to 381 and grows Type II to 632. Since the functional call for 2,500 of the 3,629 variants depends on that cutoff, the report concludes that the size of the Type I group is much less robust than its existence, a more cautious reading than the earlier analysis step, which had called the group stable under all of its sweeps.
While auditing the failure-mode table at write-up time, the agent found that it was not the clean partition its layout suggested. Two of the Type I rows are overlapping subsets of the others rather than extra categories, so adding up the rows over-counts the group, and 40 of the 220 Type II variants fall into no listed category. It reported this in a dedicated section rather than quietly fixing the table. The report also states that the analysis run hit a budget limit during a verification step, that the final planned step was never marked complete, and which outputs therefore were assembled at write-up time.
The references got the same treatment. All 72 bibliography entries were checked against a registry record, the Crossref API for everything with a DOI and the publisher's own record for the one entry without. In the first pass, 20 of 69 candidate DOIs resolved to entirely unrelated papers and were rejected, and the correct papers were then recovered by title search and verified again. The agent also rendered all 29 pages of the compiled PDF as images and reviewed them, which caught an undefined table reference and a garbled sentence before delivery.
What This Means for Variant Interpretation
The practical conclusion of the report is narrow and, I think, correct. Structural evidence is strong positive evidence when a specific mechanism is visible, such as a lost DNA contact, a destroyed zinc ligand or a severely disrupted core. The absence of a structural signal is much weaker evidence that a variant is benign, because the most common reason a TP53 variant looks unremarkable in the crystal is that its mechanism (oligomerization, marginal stability, temperature sensitivity or post-translational modification) is not in the crystal at all.
The broader lesson is about what a trustworthy analysis looks like. Reaching an impressive ROC-AUC on this problem is easy, since you only need to include the functional assays. The more useful work is noticing that the benchmark is circular, grouping the cross-validation so it does not reward memorized positions, keeping the hotspot-driven rule revision out of the evidence, and reporting the table that did not add up. That is what this session did, and it is the same pattern we saw when K-Dense Web read AlphaFold confidence scores region by region instead of trusting the headline number.
Try it yourself at app.k-dense.ai, or browse the full session, including every script and result file, here. Questions? Contact us at contact@k-dense.ai.