What this research found
Aqueous solubility caps how much of an oral drug dose can dissolve, yet it is hard to predict from chemical structure alone. K-Dense built a quantitative structure-property relationship model on AqSolDB, a curated set of 9,982 compounds with measured solubility, and deliberately tested it on chemical scaffolds it had never seen. A Random Forest reached an R-squared of 0.765 on that harder out-of-distribution split versus 0.820 on a conventional random split, quantifying how much apparent accuracy is inflated when close analogs leak into training.
- On 1,844 held-out compounds with scaffolds absent from training, the Random Forest reached RMSE 1.192, MAE 0.841, and R-squared 0.765, beating a Ridge regression baseline on every metric (RMSE 1.420, MAE 1.064, R-squared 0.666).
- The scaffold split is uniformly harder than a random split. Random Forest RMSE rises from 0.990 to 1.192 and R-squared falls from 0.820 to 0.765, so reporting only the random-split number overstates prospective accuracy on novel chemistry.
- The best model places 70.0% of scaffold-held-out compounds within one log unit of the measured value, against 58.2% for Ridge.
- Two independently trained models agree on what drives poor solubility: lipophilicity and molecular size. Calculated octanol-water partition coefficient is the top Random Forest feature (importance 0.084), while molecular surface area carries the largest negative Ridge coefficient (-0.98), followed by lipophilicity (-0.78) and molecular weight (-0.73).
- A specific fragment effect was validated without the model: compounds containing an extended all-carbon chain motif (present in 645 of the 9,220 compounds) are on average 1.52 log units, roughly 30-fold, less soluble than those without it.
- Polar and hydrogen-bonding descriptors correctly carry positive weight — hydrogen-bond acceptors +0.31, donors +0.17, polar surface area +0.03 — indicating the model learned physically meaningful chemistry rather than spurious correlations.
How it was done
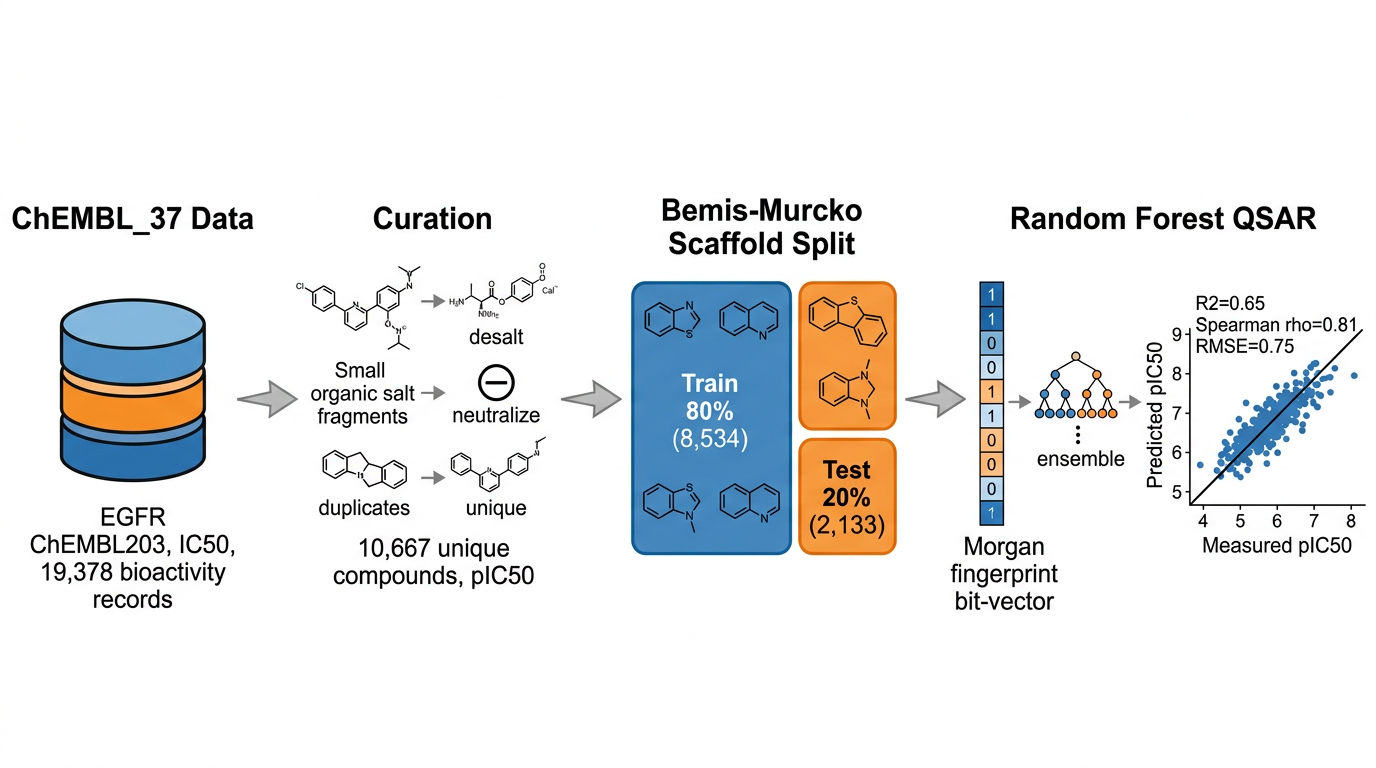
AqSolDB version 1.0 was retrieved from the Harvard Dataverse and verified by checksum, then curated: RDKit structure standardization, de-duplication by standard InChIKey with conflicting values averaged, and removal of 124 discordant compounds whose duplicate measurements disagreed by more than 1.5 log units, leaving 9,220 compounds. Each molecule became a 2,066-dimensional vector combining a 2,048-bit Morgan fingerprint of radius 2 with 18 RDKit 2D physicochemical descriptors, standardized using training-set statistics only. Ridge regression and a Random Forest were tuned by five-fold cross-validation and evaluated under two 80/20 partitions: a Bemis-Murcko scaffold split with zero scaffold overlap, and a random split as an in-distribution reference. Model interpretation combined signed Ridge coefficients, Random Forest impurity importances, and model-free comparisons of mean solubility for compounds with and without each candidate fragment.
Data sources
- AqSolDB v1.0, Harvard Dataverse doi:10.7910/DVN/OVHAW8, released 2019-07-18 — 9,982 compounds with experimental LogS
- Sorkun, Khetan & Er, Scientific Data 6:143 (2019) — the AqSolDB descriptor paper
- Delaney, ESOL, Journal of Chemical Information and Computer Sciences 44:1000 (2004)
- Yalkowsky & Valvani General Solubility Equation, Journal of Pharmaceutical Sciences 69:912 (1980)
- Wu et al., MoleculeNet, Chemical Science 9:513 (2018) — source of the scaffold-split convention
Limitations
AqSolDB pools measurements from heterogeneous sources, and residual experimental noise of roughly 1.0 log units within duplicate groups puts a floor on achievable error. The representation is purely 2D and ignores conformation and solid-state properties such as melting point, ionic species and organometallics are under-represented and produced the largest residuals, and no formal applicability-domain or uncertainty estimates were produced.
How this research was produced
K-Dense Web planned and ran this drug discovery investigation end to end — gathering the sources, carrying out the analysis, producing the figures, and drafting the report. The full session transcript, including every intermediate step, is available to view.