What this research found
Spatial organization of the tumor microenvironment is widely assumed to carry prognostic information beyond simple cell counts. Working from imaging mass cytometry of 285 Basel breast-cancer patients, leakage-controlled nested survival models showed that cell-type composition does improve discrimination over clinical variables alone, lifting the out-of-fold C-index from 0.7249 to 0.7644, while a 33-feature spatial panel fell back to 0.7350. The work is written up as a negative result, with a recommendation to advance the simpler model.
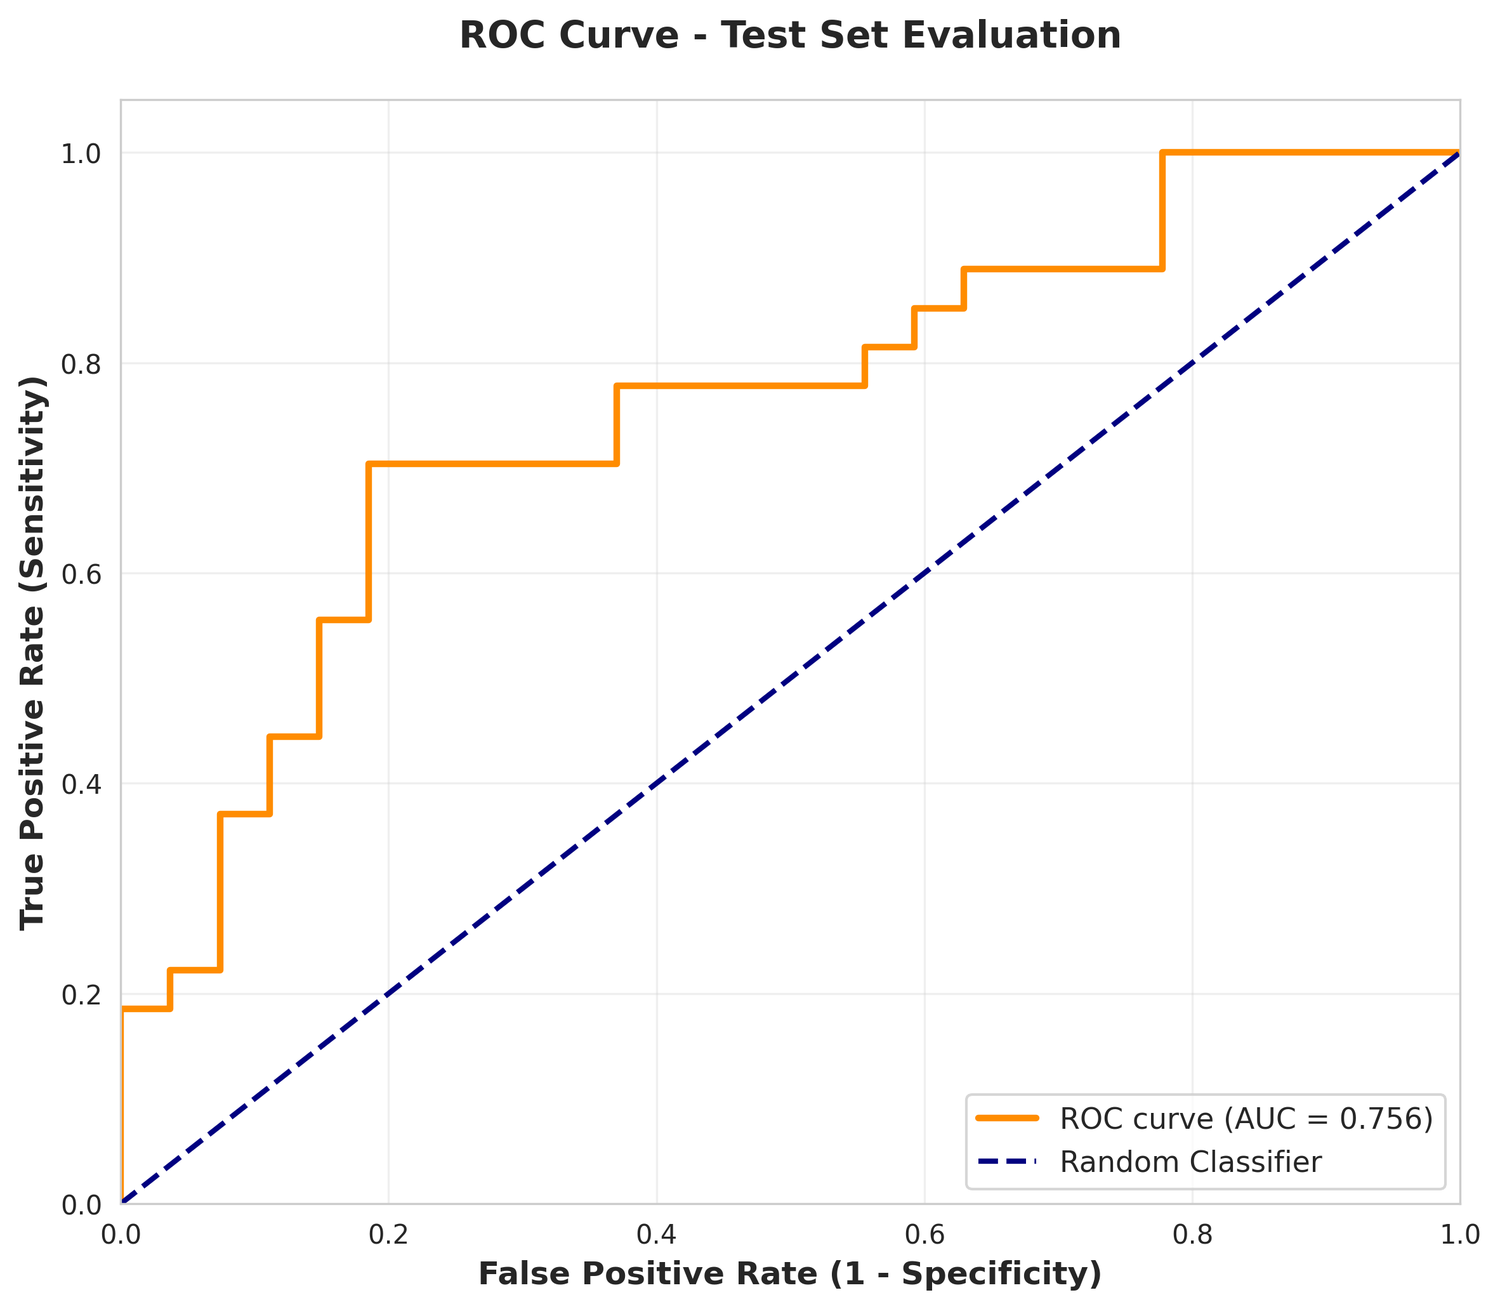
- Cell-type composition added prognostic value that held up out of fold. Adding tumor, stroma, immune, and vessel fractions to the clinical model raised Harrell's C-index from 0.7249 to 0.7644, a gain of +0.0394 whose bootstrap 95% confidence interval (+0.0064 to +0.0729) excludes zero.
- The full spatial panel degraded discrimination rather than improving it. The 33-feature model scored 0.7350 out of fold, a change of -0.0292 (95% CI -0.0775 to +0.0109) against the composition model, and no better than clinical variables alone (+0.0102, 95% CI -0.0461 to +0.0597).
- Dimensionality is the likely cause: 33 features against only 80 death events, a feature-to-event ratio of 0.413, with the cumulative Ripley's L statistics at 20, 50, and 100 pixels highly collinear and inflating variance despite elastic-net penalization.
- Permutation testing across 376 cores recovered the expected microenvironment biology, with mean neighborhood-enrichment z-scores of +28.1 for tumor-tumor contacts, +13.6 immune-immune, and +11.4 vessel-vessel, against -13.6 for tumor-immune and -19.9 for tumor-stroma, consistent with immune exclusion and tumor-stroma compartmentalization.
- The resulting recommendation was to simplify: take the clinical-plus-composition model to external validation, optionally alongside a single biologically motivated spatial scale, rather than the full 33-feature spatial panel.
How it was done
Imaging mass cytometry data from the Jackson and Fischer single-cell pathology landscape of breast cancer was retrieved from Zenodo, streaming only the required tables out of a 36.85 GB archive by HTTP range request. Spatial features were then built for all 376 Basel cores from 844,498 labeled cells: contact graphs at a 20-pixel radius scored against 1,000 within-image label permutations, which separates organization from sheer abundance, plus edge-corrected cross-type Ripley's L at 20, 50, and 100 pixels. Cores were aggregated to 285 patients by cell-count-weighted mean, and three nested feature blocks (clinical, plus composition, plus spatial) were compared using elastic-net penalized Cox models under patient-grouped five-by-five nested cross-validation, with scaling and hyperparameter selection confined to each training partition.
Data sources
- Basel and Zurich breast cancer imaging mass cytometry cohort, version 2 (Zenodo 10.5281/zenodo.4607374)
- Jackson, Fischer et al., The Single-Cell Pathology Landscape of Breast Cancer, Nature (2020)
- 1,288,795 located single cells across 746 imaged cores, of which 855,668 Basel cells and 285 patients entered the analysis
Limitations
Overall-survival follow-up exists only for the Basel arm, since the Zurich microarray has none, so no external validation was possible, and the 80 death events among 285 patients cap how many features any model can support. Clinical covariates were imputed by mode after patient aggregation rather than inside each fold.
Figures from this analysis
How this research was produced
K-Dense Web planned and ran this cancer biology investigation end to end — gathering the sources, carrying out the analysis, producing the figures, and drafting the report. The full session transcript, including every intermediate step, is available to view.