What this research found
Head and neck squamous cell carcinoma (HNSCC) responds unpredictably to treatment, so tumor expression profiles from 270 patients were searched for a signature separating those whose disease progressed from those whose did not. No single gene survived multiple-testing correction — 0 of 31,330 genes reached a false discovery rate below 0.05 — yet a random forest built on the 20 top-ranked genes classified held-out patients with a ROC-AUC of 0.7558. Whatever signal exists here is combinatorial and weak rather than attributable to any individual marker.
- No individual gene distinguished the two outcome groups after correction. Zero of 31,330 genes reached a false discovery rate below 0.05, 563 (1.8%) passed an uncorrected p-value of 0.01, and fold changes among the top 20 spanned only 0.03 to 0.34 on a log2 scale.
- A random forest on those 20 genes reached a ROC-AUC of 0.7558, accuracy of 0.6852, sensitivity of 0.7037 and specificity of 0.6667 on 54 held-out patients, correctly calling 19 of 27 who progressed and 18 of 27 who did not.
- Cross-validated performance was lower than the held-out figure at a ROC-AUC of 0.7019 ± 0.0550, and the gap against a mean training score of 0.9968 indicates the model overfits its training data.
- The three most informative features were LOC645946, an uncharacterized locus, at an importance of 0.078; SCYE1, also known as EMAP-II, a pro-inflammatory cytokine with context-dependent effects on tumor angiogenesis, at 0.071; and C9ORF126, now annotated as NMRK1, an enzyme in NAD+ salvage biosynthesis, at 0.065.
- Outcome labels were derived from progression-free survival rather than radiological assessment: 137 patients with no progression event during follow-up were treated as complete responders and 133 with a progression event as progressive disease, a near-even 50.7% to 49.3% split.
How it was done
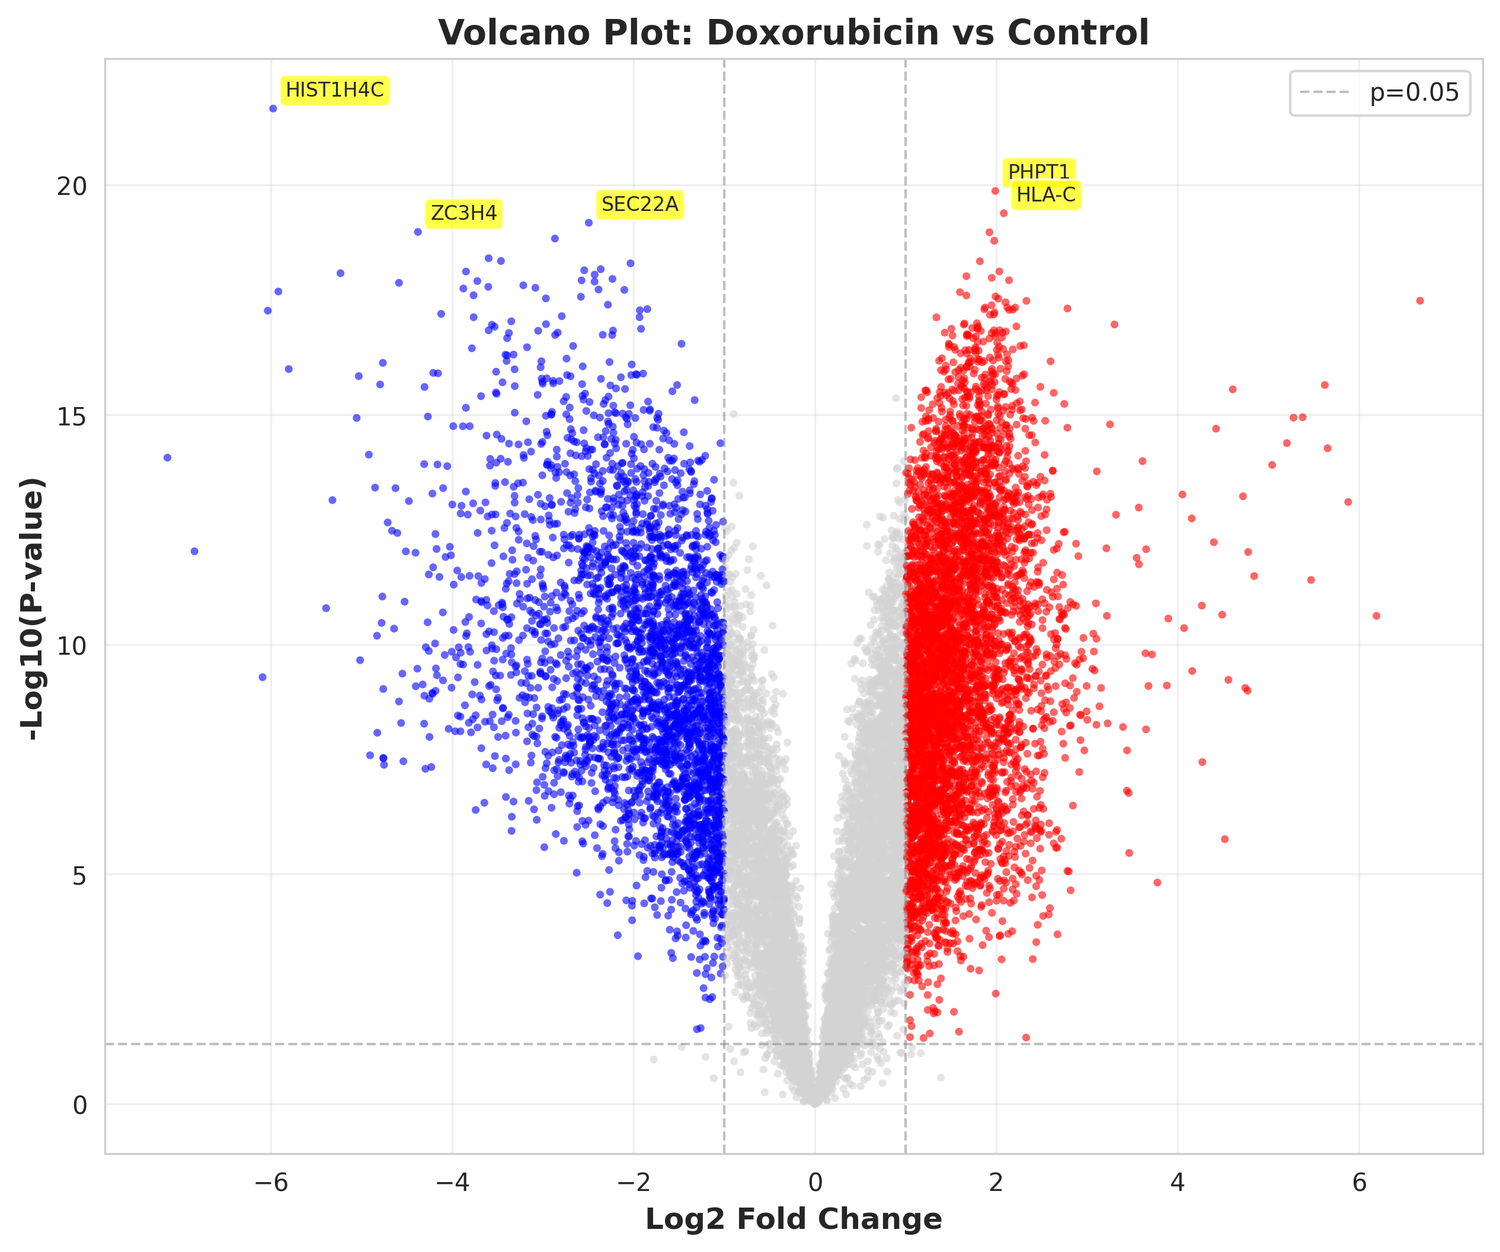
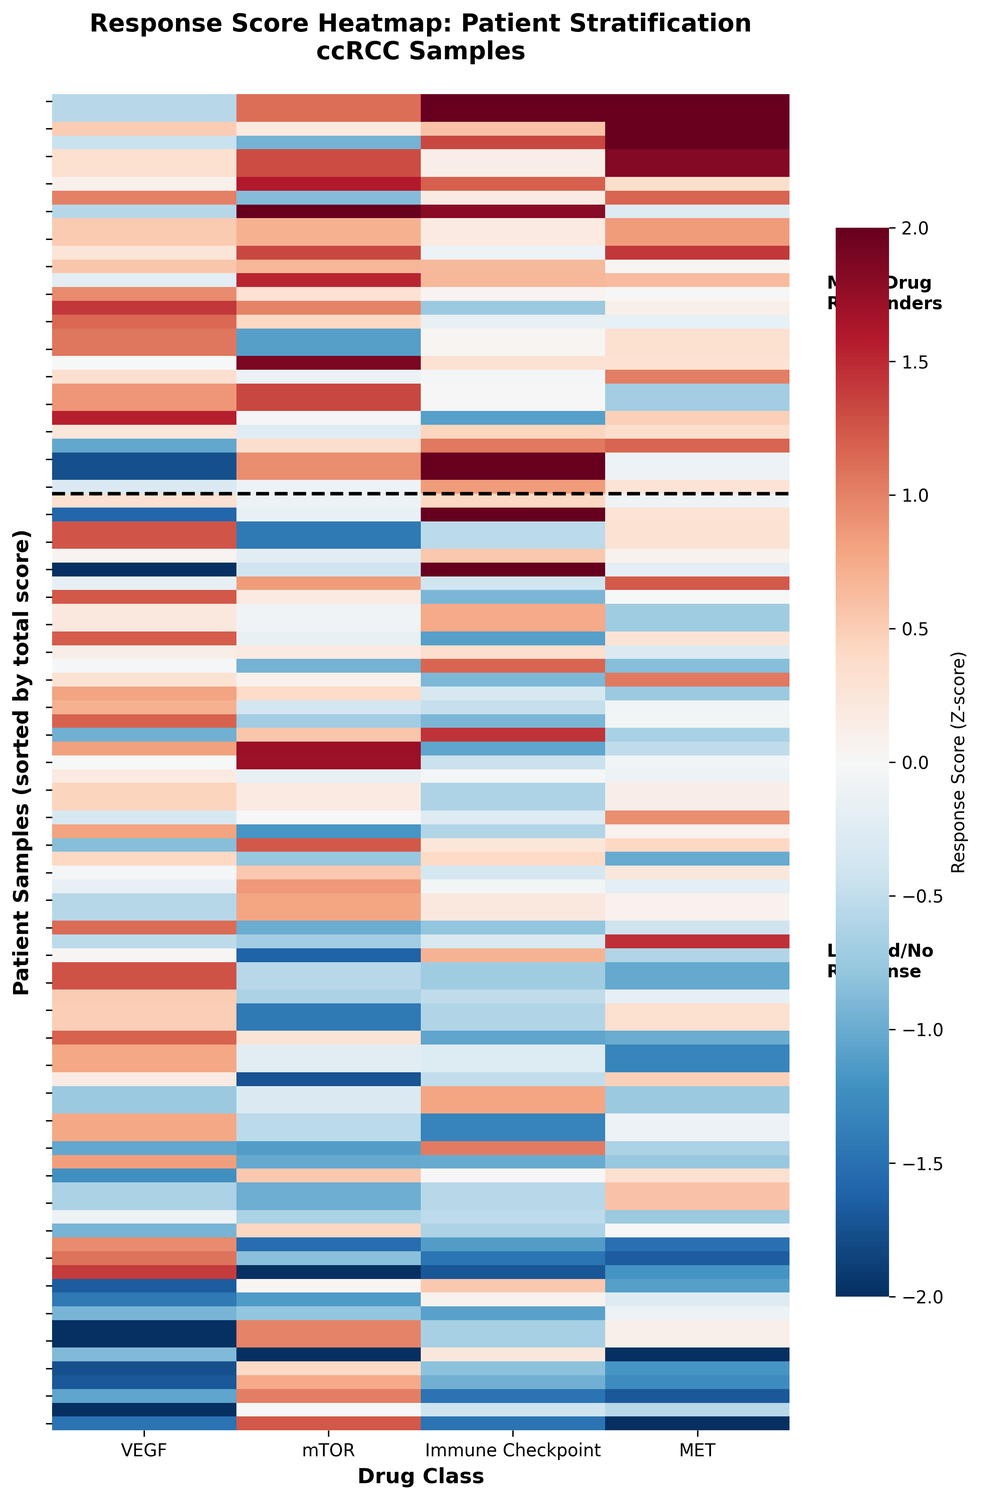
Head and neck cancer expression data was retrieved from the Gene Expression Omnibus under accession GSE65858 — 270 tumors across 31,330 genes, already log2-normalized. No India-specific HNSCC dataset carrying treatment response data was found in the repository, so this general cohort was used instead. Patients were labeled by progression-free survival event, Welch's t-test was run across every gene with Benjamini-Hochberg correction, and the 20 genes with the lowest raw p-values were carried forward as model features. A random forest was tuned by grid search over 24 hyperparameter combinations under 5-fold cross-validation, then evaluated on a held-out set of 54 patients, and the highest-ranked features were annotated for biological plausibility. Supporting outputs included a volcano plot, a hierarchically clustered heatmap of the 20 genes across all 270 samples, and a written paper.
Data sources
- Gene Expression Omnibus accession GSE65858 — 270 head and neck cancer tumors profiled across 31,330 genes on the Illumina HumanHT-12 V4.0 platform (GPL10558), with 137 non-progressors and 133 progressors
Limitations
The 20 features were chosen by differential expression across the entire dataset, including the samples later held out for testing, so the reported test metrics are an upper bound rather than an unbiased estimate of generalization. The cohort is also not India-specific as originally intended, and treatment response was inferred from progression events rather than directly measured.
Figures from this analysis
Outputs produced
- 0.081 MB
clinical_data.csv
Clinical metadata for 270 HNSCC samples with CR/PD classification
- 57 MB
expression_data.csv
Normalized gene expression matrix (log2-transformed)
Comprehensive dataset summary and validation
- 4.1 MB
dea_results.csv
Complete differential expression analysis results for all genes
top_20_biomarkers.csv
Top 20 candidate biomarker genes for ML modeling
Trained Random Forest classifier (optimized via grid search)
X_train.csv
Training features (20 biomarker genes)
y_train.csv
Training labels (CR=1, PD=0)
What this would have cost
This session was one of 67 audited against what a qualified specialist would spend producing the same deliverable alone, at mid-market US consulting rates.
Order-of-magnitude estimates (±30%) by design. The human baseline assumes one specialist working full-time without queueing or meetings, and excludes data and software licensing. The K-Dense figure is the credits a session consumed, valued at the Plus rate. What you are actually charged is capped per run — $9 at Standard, $29 at Pro — so the real gap is wider than shown. Full methodology.
How this research was produced
K-Dense Web planned and ran this cancer biology investigation end to end — gathering the sources, carrying out the analysis, producing the figures, and drafting the report. The full session transcript, including every intermediate step, is available to view.